 |
Profile Fitting
I. Theory |
|
|
Profile Fitting
I. Theory |
Theory
"The method of using the total integrated intensities of the separate groups of overlapping peaks in the least-squares refinement of structures, leads to the loss of all the information contained in the often detailed profile of these composite peaks. By the use of these profile intensities instead of the integrated quantities in the refinement procedure, however, this difficulty is overcome and it allows the extraction of the maximum amount of information contained in the powder diagram." H. M. Rietveld. §
The big break through in the use of powder data for serious structural work came about for two reasons: Rietveld realised that the detailed profile of an angle-dispersive neutron powder-diffraction pattern contained a lot more information than the extracted intensities of composite peaks. This is demonstrated in the figure below where, for example, the clickable region highlighted by the blue rectangle has two composite peaks composed of 10 different reflections.
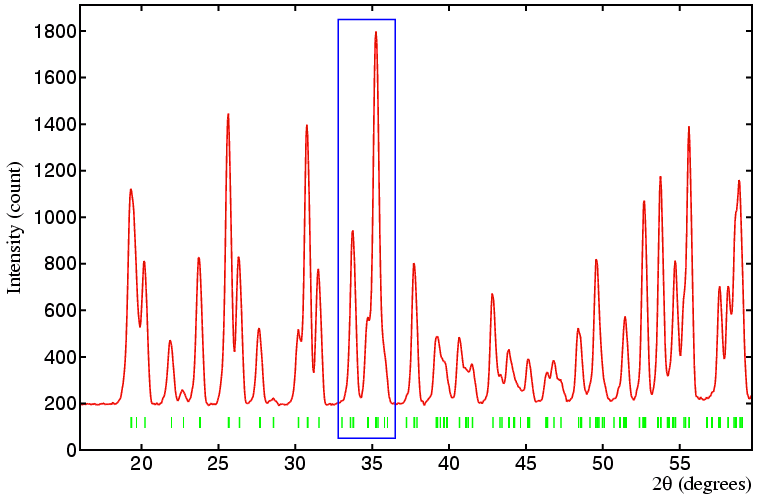
Figure: The red line shows the powder diffraction pattern of the solid phase of the freon gas fluoro-trichloromethane as measured on the powder neutron diffractometer D2B at the ILL, Grenoble. The green vertical tick lines indicate the position of peaks as determined from the unit-cell parameters and space-group symmetry (see Case Study in Symmetry IV).
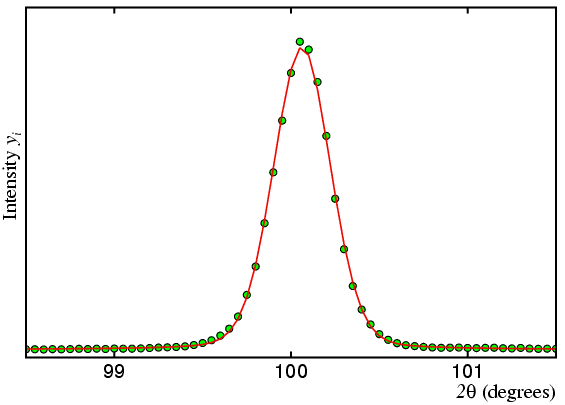
The measured profile of a single powder neutron diffraction peak on an angle-dispersive diffractometer is dependent on the neutron spectral distribution, the monochromator mosaic distribution, the transmission functions of the collimation (due to Soller slits), and the sample shape and crystallinity. While each of these functions is not itself necessarily Gaussian (e.g. the collimation functions are triangles), it is an empirical fact that their convolution produces an almost exactly Gaussian peak shape as shown in figure below:
The Gaussian peak-shape function, G, is given by:
Rietveld realized that the detailed profile could be fitted on a point by point basis using the simple Gaussian peak-shape function without any need to extract intensities of composite groups of reflections. The intensity, yi, of the i th profile point may be written as the summation of the contribution of the profiles of all reflections to that point:
| yi | = | Σ hkl |
G (xi, Ihkl, H) |
| = | Σ hkl |
√ (4 loge2 / π) Ihkl exp {- 4 loge2 (xi - 2θhkl )2 / H2 } / H | |
| = | Σ hkl |
√ (4 loge2 / π) c jhkl L(2θ) F2(hkl) exp {- 4 loge2 (xi - 2θhkl )2 / H2 } / H |
where
This is demonstrated in the figure below for part of a powder diffraction pattern profile shown in red, which is due to the presence of two reflections shown in green and cyan. The intensity contribution to the profile at the point i is simply given by

In practice, the powder diffraction profile has a background count attributable to variety of factors: instrumental background count, incoherent scattering, inelastic scattering, thermal diffuse scattering, electronic noise, etc., in addition to the sharp Bragg diffraction peaks. A background is readily seen in the experimental diffraction data shown at the top of this page.
An expression for the peak width as a function of scattering angle had been derived theoretically many years previously by Cagliotti, Paoletti, & Ricci as:
This is simply a parabolic function in tanθ characterized by 3 peak-width parameters, U, V, W (as shown in earlier figures A and B and discussed in the previous section). This simple formula not only describes the instrumental resolution of a powder diffractometer, but to some extent takes into account sample effects such as particle size which slightly can broaden the diffraction peak.
The quantity Δ that is minimized is given by the expression:
| Δ | = | Σ i |
wi { yi(obs) - yi(calc)}2 | ||
| = | Σ i |
wi { yi(obs) - | Σ hkl |
||
| F(hkl) = | Σ n |
bn Nn exp { 2πi (hxn + kyn + lzn) } exp { - Bn sin2θ / λ2 } |
How the function Δ is calculated in practice and its parameters refined will be described in the next few pages.
![]() § H. M. Rietveld:
A profile refinement method for nuclear and magnetic structures.
Journal of Applied Crystallography,
1969, 2, 65-71.
§ H. M. Rietveld:
A profile refinement method for nuclear and magnetic structures.
Journal of Applied Crystallography,
1969, 2, 65-71.
| © Copyright 1997-2006. Birkbeck College, University of London. | Author(s): Jeremy Karl Cockcroft |