 |
Whole Pattern-Fitting Quantitative Analysis
II. A Worked Example |
 |
Whole Pattern-Fitting Quantitative Analysis
II. A Worked Example |
A Worked Example
This was an experiment conducted with the purpose of analysing data using the whole pattern Rietveld method of structure refinement to obtain experimental quantitative values from a series of known binary phase samples. Only one of the data sets will be dealt with in detail.
A total of 9 mixtures of anatase and rutile were prepared as described earlier (The Absorption Problem) with ratios ranging from 1:9 to 9:1 rutile : anatase at 10% increments. Each sample required careful weighing and thorough mixing before being back-packed into the holder to reduce possible preferred orientation effects. Additionally, the sample was rotated in the beam to reduce texture effects. Data were collected on a Bragg-Brentano θ/2θ machine with copper Kα radiation and a pre-sample monochromator to eliminate the Kα2 component.
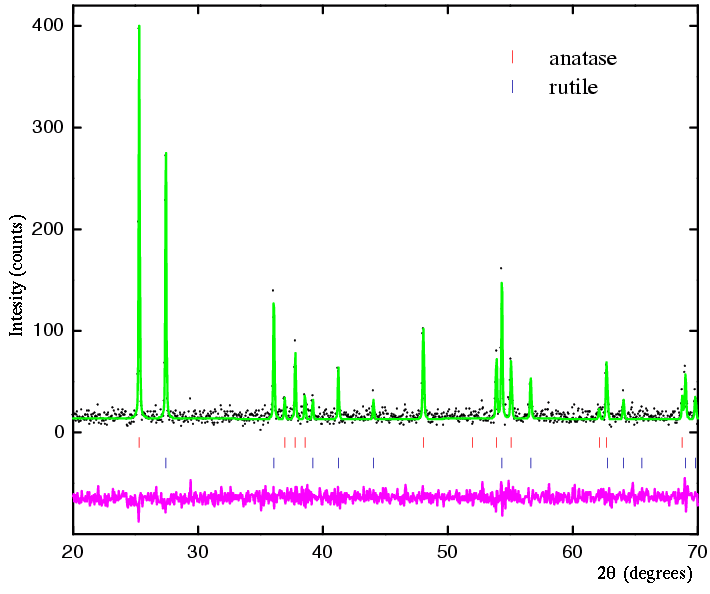
By the usual standards for Rietveld analysis the data were collected relatively crudely. A suitable range of 20 to 70° 2θ was chosen to include the most major intensity lines and stepped at 0.05° increments, counting for 5 seconds per step. Normally for structure refinement work a more time consuming data collection would be required, with finer steps, longer counts (especially at higher angles) and broader 2θ ranges (see Instrumentation I: Data Aquisition). The data plotted below are from the 50% anatase 50% rutile mixture. Overlaid are the ICDD standards for anatase (black) and rutile (red).

Not all parameters were allowed to vary during the actual refinement. Specifically, those relating to atomic values (co-ordinates and thermal parameters) were fixed as the data are not of sufficient quality for a structure refinement. Once the refinement had converged, the weighted profile R-factor came to about 13% with an expected value of about 12%. The quantitative result yielded 49% anatase 51% rutile (± 1.8%). The refinement is illustrated below:

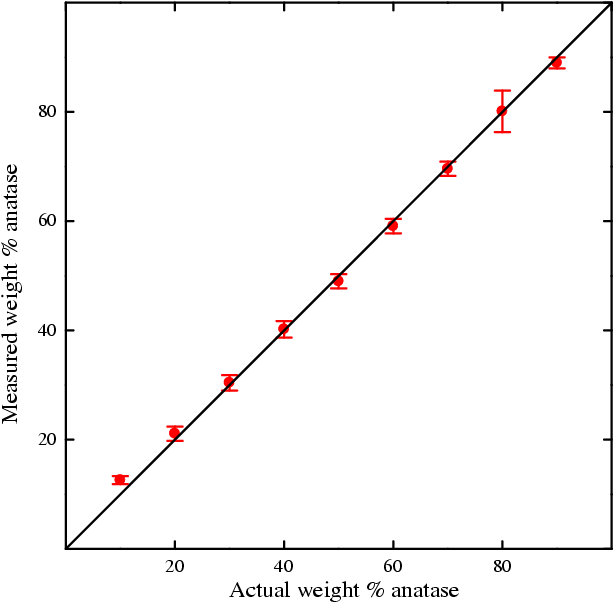
Refining all 9 data sets produced the following results plotted here against the actual weight % of material. Error bars are shown for the determined weights of anatase, these again being derived from the esd's obtained from the refinement: in this case it is the esd's on the scale factors that feed into the formula for the weight fraction (by Hill and Howard as on previous page) and yield actual error bars. Again one must note that there can be other less recognisable factors that can influence the result (see below) and that this example is an ideal case.

The following is a general list of many of the factors that have to be taken into consideration when performing quantitative analysis on less ideal samples than the above. While whole-pattern methods have helped to reduce these problems, they have not eliminated them entirely:
|
© Copyright 1997-2006.
Birkbeck College, University of London.
|
Author(s):
Paul Barnes Martin Vickers |