 |
Data Acquisition |
 |
Data Acquisition |
Data Acquisition
Counting Methods
Historically, data acquisition used film-based area detection and so the counting time was that required to give sufficient exposure of the film. With the development of scanning Bragg-Brentano diffractometers, the acquisition was linked to a chart recorder with a smoothed time-averaged count rate being recorded on chart paper. (In addition, the 2θ scale frequently went from right to left on the chart paper.) Typically, both the detector arm and the chart recorder move continuously, with the 2θ scale being determined by mechanical gearing on the 2θ motors and the chart paper speed. The 2θ speed was set so as to give a decent time-averaged signal on the chart paper.
Once computer control was introduced, data acquisition generally changed to a step scan approach in which the detector arm is move to a specific 2θangle and a total number counts for a given count time was recorded by the computer. This raises the question of step size, which is one of the variable parameters for most modern laboratory diffractometers.
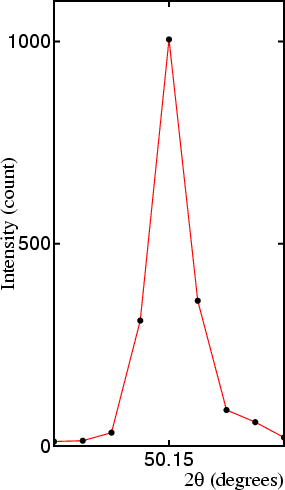
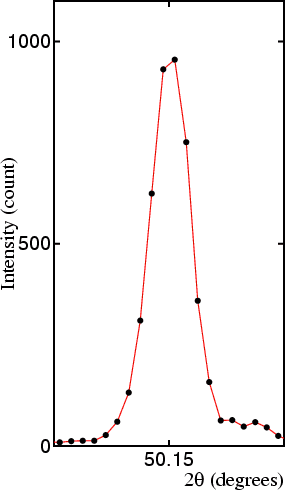
The step size depends on the object of the measurement/experiment: quick scans will often make use of relatively large step sizes, while accurate data will usually require small step sizes. The optimum choice of step size is related to the width of the peaks in 2θ. One ad-hoc rule states the number of points in the full-width at half-maximum of single peaks should be in the range 7 to 9 for good peak-profile definition: too few results in a poorly defined profile, while too many results in either waste of diffractometer time or poorer intensity statistics for a given (and finite) diffractometer time. This is illustrated in the figures (of the 112 reflection of quartz) shown below:
 |
 |
 |
||
| A | B | C |
In A the step size is 0.01°, and is clearly too small, while for B the coarse step size of 0.05° clearly results in a poorly-defined peak profile (though it provides a relatively good estimate of peak position and intensity). The step in C is close to optimum, despite having only 6 points covering the full-width of the peak at half-maximum height.
Count Times
One of the most common questions is "How long to count for?" to which the answer is usually "How long is a ball of string?". Seriously though, how long you count for should depend on what you are trying to achieve from the powder diffraction experiment, and certainly not, for example, on how much diffractometer time is available.
For the case of stationary detectors (either X-ray film or PSDs), the only time variable is one of total time and the choice of this will be influenced by how strongly the sample scatters in the X-ray beam. By contrast, for step-scanning diffractometers in which the data are collected on a point by point basis, some thought should be given to the counting method. The simplest scheme, illustrated in magenta in the figure below, is to count each 2θ data point for an equal amount of time. This is the scheme provided by most diffractometer manufactures.

The red curve is calculated from a knowledge of peak density, average scattering, thermal, and absorption factors, and geometric intensity factors. A simple way of achieving this in practice using standard diffractometer software based on equal time per data point counting methods, is to count each point for a much shorter count time, but then repeat the scan for the higher angle data so as to improve the statistics for the weaker reflections. This is represented by the cyan blocks in the above figure. The data sets are all added together on a point by point basis and then normalised according to the time spent counting each data point. By this method, optimum data for structural work may be obtained.
Sample Effects
There are several sample effects that may influence how you collect the data and for how long. The three effects discussed in the next few pages are:
The presence of any of these effects should modify your data acquisition strategy. Clearly there is little point in spending many hours or even days collecting data that will prove intractible when it comes to analysis. If any of these effects are observed, first consider your experimental objectives: in some cases you may be able to obtain the information that you want even when the data are non-ideal. It cannot be over emphasised that time well spent at the acquisition stage can save days, weeks, or even months in the analysis of your powder diffraction data.
| © Copyright 1997-2006. Birkbeck College, University of London. | Author(s): Jeremy Karl Cockcroft |