 |
Texture |
 Course Material Index
 Section Index
 Previous Page
 Next Page
Texture
Samples are often described as having preferred orientation when actually
they are textured and vice versa: some samples, especially worked
metals, for example, may exhibit both.
Whatever the language used, it is important
to recognise the symptons in the powder diffraction data that are due to:
- samples in which the orientation
of the crystallites is non-random in a systematic way, and
- samples in which there are insufficient crystallites to provide
a true powder diffraction pattern.
The first case is easily discerned when the sample is measured in more than
one diffraction geometry and is referred to as sample
preferred orientation (as discussed previously).
The second case tends to result in random data and is often referred
to as sample texture. It
is commonly caused by crystallites that are too large, and therefore
insufficiently numerous, to provide a true powder average. In this case sieving
may provide a solution by removing the largest crystallites, though not all
samples are amenable to this technique.
Metal samples in particular can be a problem here.
The effect of texture is demonstrated below using an "off the shelf" sample
of potassium chromate, K2CrO4, measured with Cu
Kα1
on a Bragg-Brentano diffractometer.
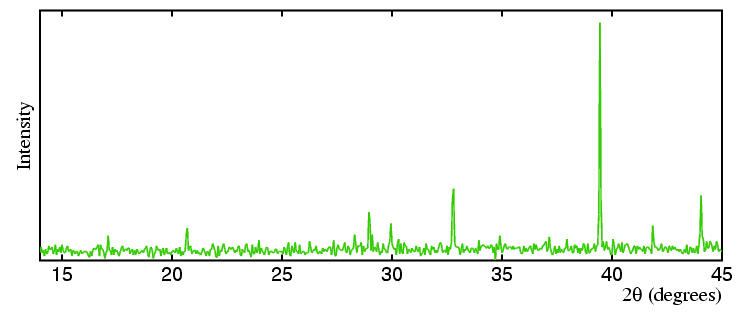
The first diffraction data shown in green below
is from a stationary (non-spinning) sample that failed to pass through a
250 µm sieve. The diffraction pattern
is generally weak with fewer peaks than expected.
Though not easy to see in these plots, a common symptom of texture is the
presence of peaks that are narrower than the instrumental resolution function.
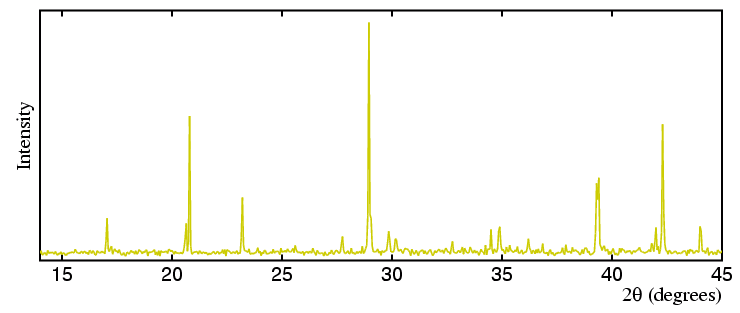
 The second diffraction pattern is from a non-spinning
38 to 100 µm sieved fraction of potassium
chromate.
More diffraction peaks are now visible, but the relative intensity of the
peaks is poor compared to the expected values from a non-textured sample.
The second diffraction pattern is from a non-spinning
38 to 100 µm sieved fraction of potassium
chromate.
More diffraction peaks are now visible, but the relative intensity of the
peaks is poor compared to the expected values from a non-textured sample.
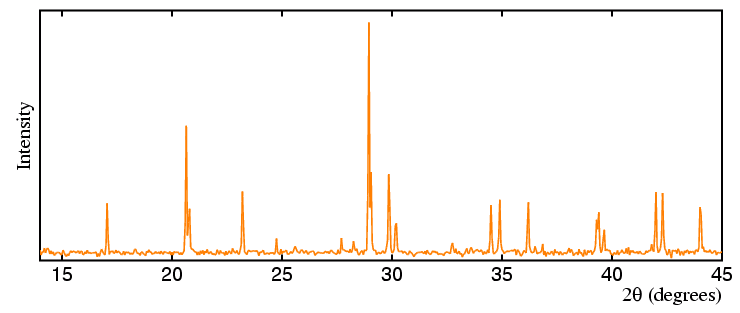
 Spinning the same sample does give some improvement to the powder pattern,
but the presence of the large crystallites still dominates the diffraction
data shown in orange below:
Spinning the same sample does give some improvement to the powder pattern,
but the presence of the large crystallites still dominates the diffraction
data shown in orange below:
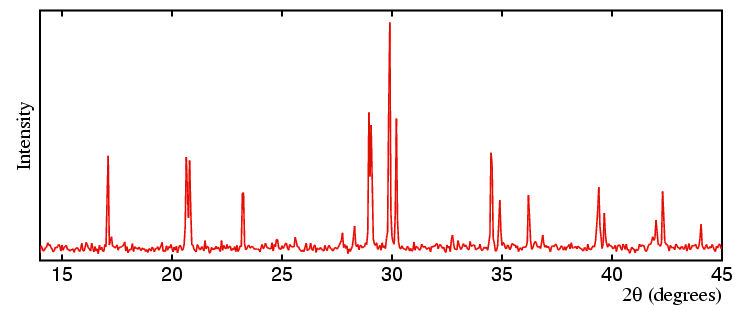
 The final pattern, shown in red below, is from
a spinning sample of K2CrO4 that was ground and
passed through a 38 µm sieve.
The peaks now have closer relative intensities to the expected values;
and a Rietveld fit (taught later in the course) of the crystal structure
to the data will be the best way to demonstrate this.
The final pattern, shown in red below, is from
a spinning sample of K2CrO4 that was ground and
passed through a 38 µm sieve.
The peaks now have closer relative intensities to the expected values;
and a Rietveld fit (taught later in the course) of the crystal structure
to the data will be the best way to demonstrate this.
Course Material Index
Section Index
Previous Page
Next Page