 |
Using Rietica: I. Viewing the Data |
 |
Using Rietica: I. Viewing the Data |
Viewing the Data
The discussion in this section is based solely around Rietica, though some of the comments will also apply to Rietveld programs in general. The screen snap shots shown are based on version 1.7.7 of Rietica. It is assumed that you are capable of downloading and installing the software package. In addition, you will have to download the data and make sure that it has the file extension ".dat". The example given here is based around the room temperature data set of lead sulphate described in the earlier case study.
When Rietica is first run, you should observe a window like the one shown below:

As with many GUI type interfaces, the use of this program may not be intuitive for the first time user. While one solution may be to read the manual, this seems to defeat the whole object of having a GUI interface in the first place. The main menu options are File, Edit, Model, Rietveld, Information, and Help. In addition, there are a series of icons whose function may or may be not so obvious.
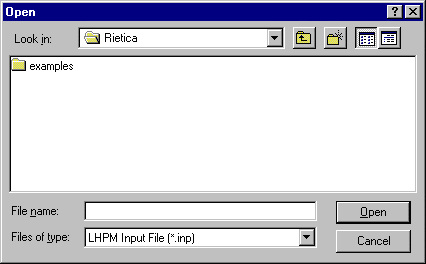
Probably the first step in any crystal structure refinement by the Rietveld method will be a preliminary examination of the data. For example, it may be necessary to confirm that the contents of a powder diffraction data set match the name of the file in which the data were stored. To do this in Rietica, you will need to do the following. Firstly, click on File, and then on Open in the pull-down menu. This will open a window like the one shown below (which by default points to Rietica's own directory):

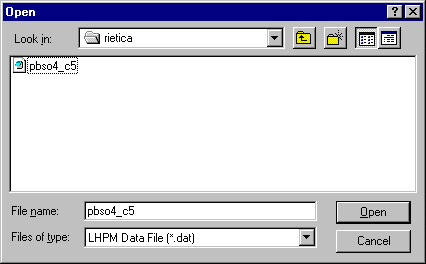
Use the pull-down menu at the bottom of this window to change the type of file to ".dat", i.e. to data files. Additionally, you will need to change to your own working directory in which the data is stored. (I had a subdirectory called "rietica" containing a single data file.) Click on the data file of interest and, at this point, the window should now look like the one below:

Once you have chosen the file of interest, click on Open and you should see your data in a new plot window:

The plot window can be resized using the mouse (e.g. by grabbing the corners of the window and dragging). The pull-down menu Chart and option Edit (as opposed to the pull-down menu Edit) has many features that you will find useful when producing "final" plot files for reports, etc. You should try these out at some stage.
You should note that the above procedure is simply to let you view the data before starting out on any Rietveld refinement of your crystal structure. Finally, if you close the plot window showing the raw data, you can only get it back by going through the File, Open option as described above.
|
© Copyright 2001-2006.
Birkbeck College, University of London.
|
Author(s):
Jeremy Karl Cockcroft Lachlan M.D. Cranswick |