 |
Using Rietica: VI. Refinement |
 |
Using Rietica: VI. Refinement |
Refinement
Having setup the data and crystallographic model, you are now in a position to commence the process of Rietveld refinement. The first parameter to refine is the scale factor (which starts with the arbitrary value of 0.01): you have set this parameter as refinable in the Model pull-down menu and sub-option Phases.
So now click on the Rieveld pull-down menu and choose the option Refine (as done previously for entering the background data):
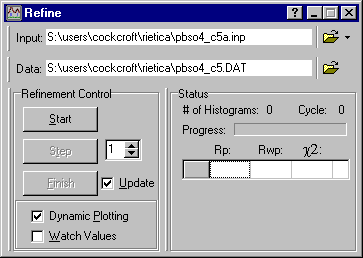
The option Start is slightly misleading since it does not actually start the refinement process: it is a more of a "get ready" to refine button. Clicking it will bring up the plot of the diffraction data and the background as input graphically as shown below:
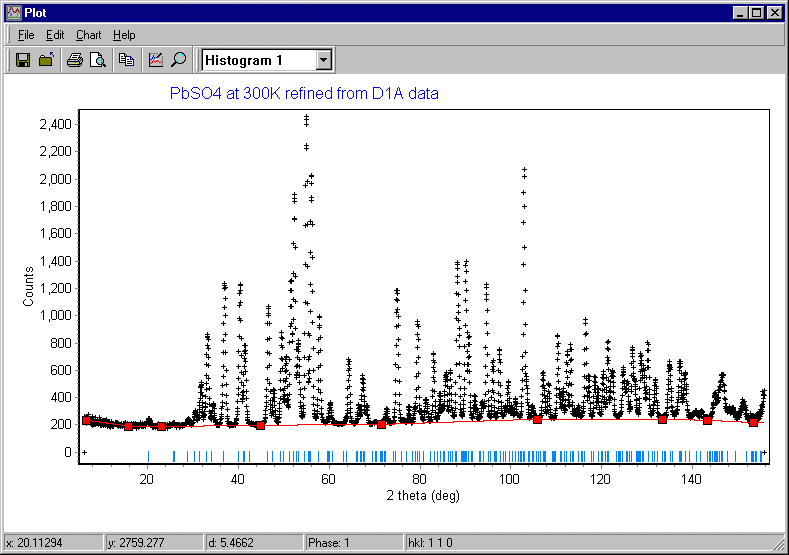
Note that no calculated pattern is shown yet, but this time the calculated reflection positions shown in blue match the observed positions of the diffraction peaks. If they do not, you should quit the refinement procedure at this point and check that the following have been correctly set: lattice parameters, wavelength, and 2q zero error. Now trying clicking on the Step button in the Refine window:
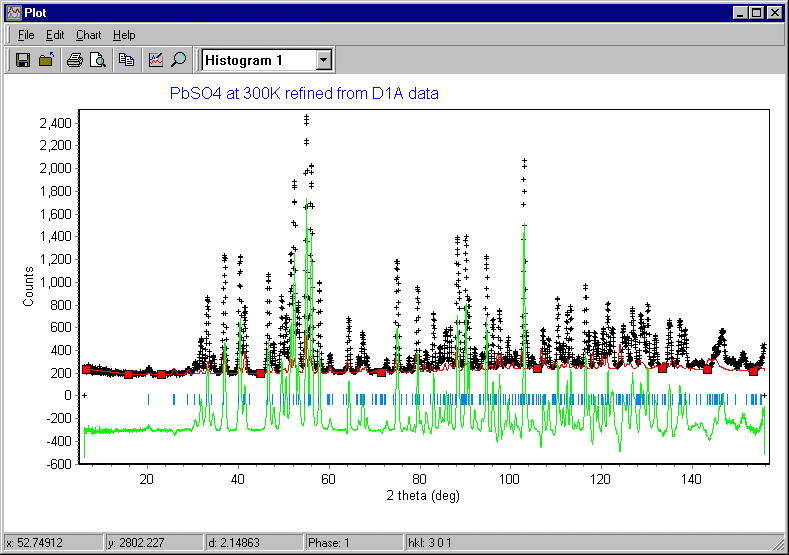
The plot window will update and you will now see the calculated data (shown in red) and a difference plot (shown in green). Since the scale factor was arbitrary, the match between observed and calculated is poor at this point:
The refine menu showed a number of cycles of refinement, which took the default value of 1 in the screen window shown above. This is the number of refinement cycles that the program will run for when you click on Step. The number should be less than the maximum number of cycles set in the Model pull-down menu and sub-option General (which was set to 30 in the previous page). You increase the number from the default value of unity to say 3 or 5, and click on the Step button again ["continue" would be a better name for this button]:
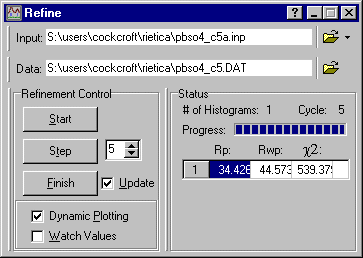
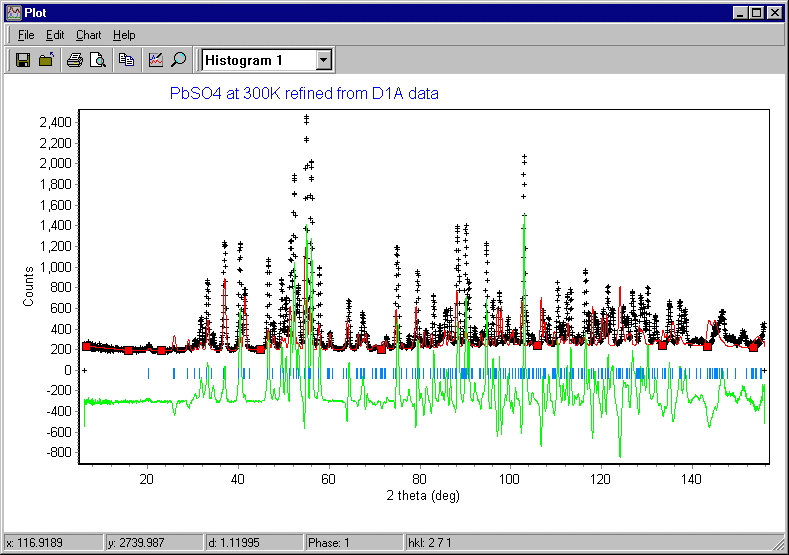
In addition to the plot being updated each cycle of refinement, so will the Refine window. Rietica shows two R-factors and a chi-squared value: you should monitor the values of Rwp and c2 during the refinement of the crystal structure. After refinement of the scale factor the weighted-profile R-factor is 44.6%: this is better than you would get with a random model and indicates some correlation between observed and calculated as shown below, though obviously the fit is poor at this stage:
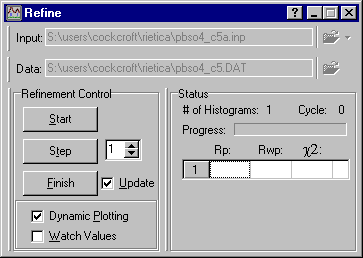
Having refined the scale factor, you need to update its values in the input parameter value. This will not happen until you click on Finish in the refinement menu. [WARNING: occasionally the program may crash at this point for some unexplained reason, but the program bug has been reported.] Assuming that all goes well, the buttons Step and Finish should be "greyed out", i.e. no longer clickable.
You can now close the Refine window, go back to the Model menu and choose some more parameters to refine. This is done by clicking on the empty box after the particular parameter that you wish to refine. Do not try clicking on all of the boxes at once, but progressively add in extra parameters as described in the case study. If your crystallographic model is correct, the refinement procedure should converge to the true minimum and you get a good visual agreement between observed and calculated. If the model is wrong, say for example you have an error in the space-group symmetry, then the refinement may partially converge to a false minimum, or may even be unstable and wander from one false minimum to another.
For practice, you could try finishing the refinement of the room temperature structure of PbSO4 using the case study steps as a guide.
|
© Copyright 2001-2006.
Birkbeck College, University of London.
|
Author(s):
Jeremy Karl Cockcroft Lachlan M.D. Cranswick |