 |
Dichotomy Methods |
 |
Dichotomy Methods |
Dichotomy Methods
Successive dichotomy uses a totally different approach to the problem of indexing. The constants A to F in the equation
are assigned minimum and maximum values so that for a given hkl triplet values of Qmin and Qmax can be calculated. All of the input lines must lie within one of these Q ranges, but with no more than one line per range. The program then successively halves the range of the constants into an upper and lower range and again Q ranges are calculated. Now if some of the lines do not fall into the smaller Q ranges, then either the upper or lower range can be rejected. Thus the constants A to F are successively decreased, thus increasing their precision. The method is potentially exhaustive, but is extremely time consuming for the lowest-symmetry crystal systems.
To demonstrate how the method works in practice, consider the powder diagram below, which actually corresponds to an orthorhombic unit cell with a = 7.75 Å, b = 5.30 Å, and c = 6.20 Å:

Testing for an orthorhombic match, the program starts with
a, b, c in the range 0 to 20 Å.
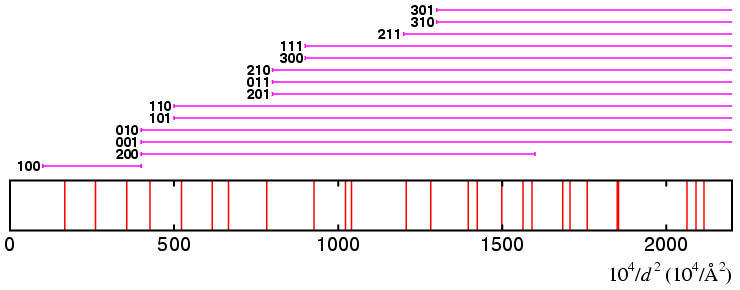
Within a few cycles of division, one might obtain the the ranges

It should be obvious that the solution cannot lie within the above limits for the lattice parameters a, b, and c since the three smallest Q reflections are only covered by one Q range, which is that for the 100 reflection. Hence the solution does not lie within these limits.
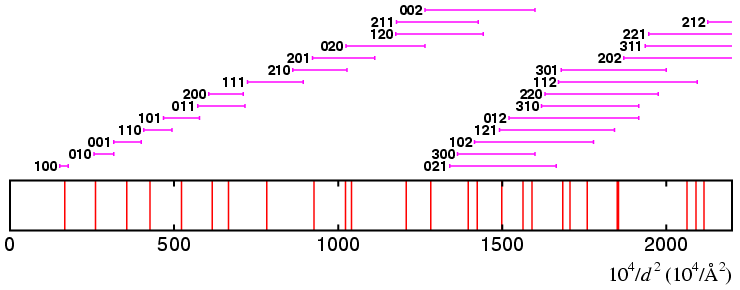
To illustrate how the solution might proceed, suppose the ranges have been
successively divided so that

At this stage of the dichotomy procedure, 7 of the first 9 lines have unique indices: at this point there is no need to divide the ranges further since precise values for the unit cell can be quickly obtained via a least-squares refinement based on the lines which have been uniquely indexed. From the refined cell parameters, the remaining lines can be indexed and a figure of merit calculated for the solution.
To demonstrate the sensitivity of the method, suppose that the
previous step had involved reducing the range of a from
6.875 — 8.125 Å
to the two ranges
6.875 — 7.500 Å and
7.500 — 8.125 Å.
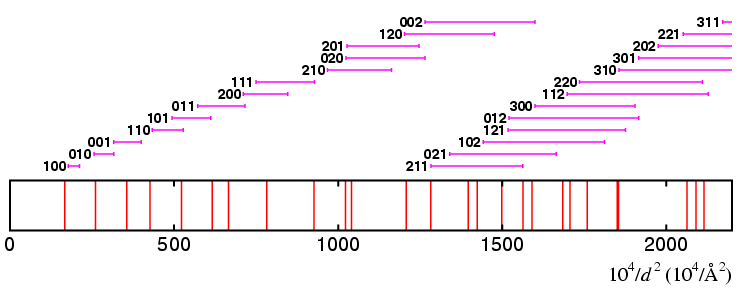
The diagram of the Q ranges covered if

This time you can see that the first and fourth lines are not covered by any of the Qhkl ranges. In addition, there are only 6 ranges that even come close to covering the first 7 lines.
The method is liable to suffer from impurity peaks in the pattern, though allowances can be made for them at the expense of additional computer time. The method works well in low-parameter space, i.e. when testing for cubic, tetragonal, and trigonal/hexagonal lattices, but the computer time increases dramatically for monoclinic and triclinic systems. Hence we need to consider a alternative approach to the problem of indexing for low-symmetry powder diffraction patterns. This is discussed on the next page.
| © Copyright 1997-2006. Birkbeck College, University of London. | Author(s): Jeremy Karl Cockcroft |