 |
Whole Pattern Fitting
II. LeBail Method |
 |
Whole Pattern Fitting
II. LeBail Method |
LeBail Method
To overcome some of the problems of the Pawley method as experienced at the time, Armel le Bail took a wholly different approach to the extraction of the peak intensities from the powder profile. The approach was simple and, perhaps more importantly, it was very easy to code into existing Rietveld programs.
The method uses a two-step cyclic process. As with the Pawley method, the following parameters are fitted by a standard least-squares methods:
Initially, all of the peak intensities are set to an arbitrary value, e.g. 1000.0. These are treated as "calculated" values as if they had been derived from a structural model. Application of Rietveld's procedure for partitioning observed profile points, y(obs), leads to a set of "observed" intensity values as described in slightly more detail below:

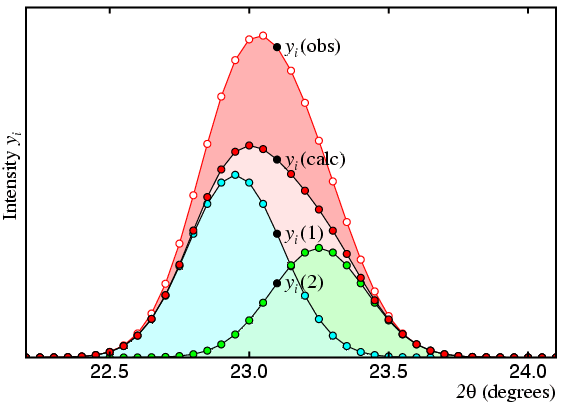
In the figure, the observed profile is shown as a red line with white dots and the calculated is shown as a black line with red dots. The observed total intensity of peak 1 (shown in cyan) is given by the expression:
| Iobs(1) = | Σ | yi(obs) × yi(1) / yi(calc) | |
| i |
Likewise, for the total intensity of peak 2 (shown in green):
| Iobs(2) = | Σ | yi(obs) × yi(2) / yi(calc) | |
| i |
where yi(calc) = yi(1) + yi(2), and the summation is taken over all profile points i that may contribute to peak intensity. This method, which is sometimes referred to as "profile intensity partitioning", works for any number of overlapping peaks and is not restricted to just two peaks as used for this illustration.
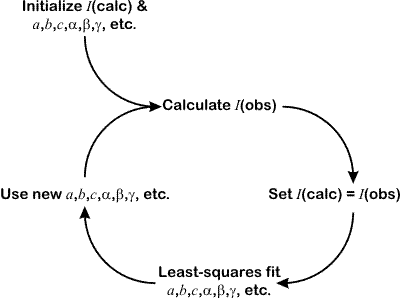
These "observed" intensity values will be biased by the starting values used for I(calc), but on average they will still be closer to the true value for the observed I(hkl) than any arbitrary value. These observed values can now be used instead of a structural model for the least-squares fitting of the diffraction profile. This leads to an improvement in (a) cell parameters and, consequently, peak positions, (b) resolution function parameters, i.e. peaks widths, and (c) peak shape parameters. The process is now iterated and a fresh set of observed intensities are obtained. The whole process is shown in the flow diagram below:

Because the process is of an iterative nature, and because least-squares is avoided for determining I(obs), the whole process converges somewhat slowly. (It is not immediately obvious that such a process will converge at all.) Typically, 10s to 100s of cycles are required, but given the very rapid speed of each cycle, this is not a problem in practice. Note that since I(calc) is set equal to I(obs) during each cycle, then the intensity R-factor will tend to zero.
Assuming that the background is determined correctly, and not overestimated, then programs that employ the LeBail method can never produce negative peak intensities.
Comparison of Pawley & LeBail methods
How do the two methods compare? This question provides much controversy between the "purists" and the "pragmatists". The former argue strongly that only the Pawley method should be used since this provides not only intensities, but esd values as well. The latter argue in favour of the speed offered by the LeBail method, and its general availability: what is the point in having mathematically perfect programs if they are not readily available "off-the-shelf" to all users? There are merits and imperfections with both methods, though the issue of speed is now becoming less important given the availability of high-speed personal computers.
Both methods intrinsically have a problem with peaks that severely overlap. This is less of a problem for the low-symmetry crystal systems (triclinic to orthorhombic) since peaks with near identical d spacings only occur randomly. However, the problem is particularly severe for the higher symmetry crystal systems since it is impossible to derive reliable peak intensities for the Laue classes 4/m (which is indistinguishable from 4/mmm by powder diffraction), -3, 3m1, 31m, 6/m (all of which are indistinguishable from 6/mmm), and m-3 (which is indistinguishable from m-3m). As well as peak overlap due to Laue symmetry, there are a significant number of special cases, particularly for the cubic crystal system even in the higher Laue class m-3m: a simple example is the identical d spacings of the 500 and 430 reflections, i.e. reflections where the sum of the indices squared are equal. In all of these cases, the profile decomposition software simple partitions the intensities equally, even though this is unlikely to be the case. Hence the difficulty of SDPD with the high symmetry crystal systems.
Uses of Pattern Decomposition
Although obtaining a set of I(hkl) may seem to be the prime objective for the two methods described, both methods have secondary functions in addition. Firstly, since the intensities are not constrained by any structural model, the final weighted-profile R-factor will be better than the R-factor than can be obtained in an Rietveld refinement: thus there is no point in trying to obtain a Rietveld refinement that is lower than the one achieve by pattern decomposition.
Secondly, the method is very useful for comparing different space group assignments. For example, if one suspected that the space group was either Pnma or Pbma (but was unable to tell by eye due to peak overlap), then a Pawley or LeBail fit using both space groups may indicate which is the better choice.
So having obtained a set of I(hkl) values from our powder diffraction data by pattern decomposition, how are the values used? The answer to this is given in the next few pages, which provide a brief overview of how crystal structures may be solved.
| © Copyright 1997-2006. Birkbeck College, University of London. | Author(s): Jeremy Karl Cockcroft |