 |
R-Factors |
 |
R-Factors |
R-Factors
It was stated earlier that the function, Δ, being minimized in the Rietveld method is given by:
| Δ = | Σ i |
wi { yi(obs) - yi(calc)}2 |
| Rwp = { | Σ i |
wi { yi(obs) - yi(calc)}2 / | Σ i |
wi yi(obs)2 | }1/2 × 100% |
| = { Δ / | Σ i |
wi yi(obs)2 }1/2 × 100% |
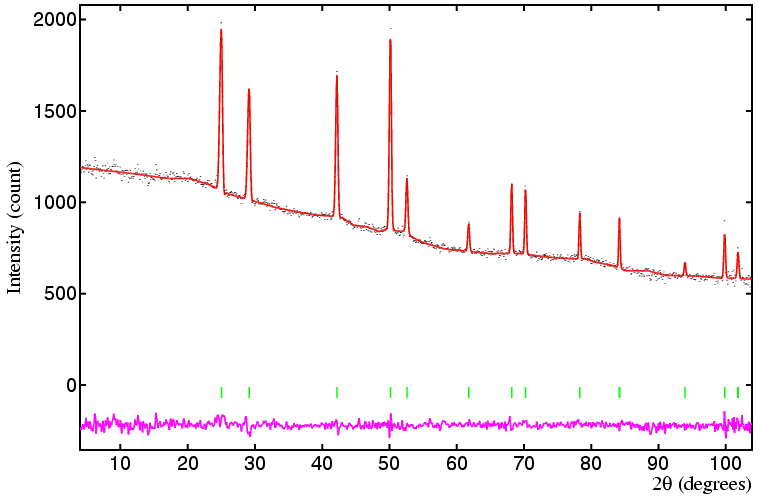
As an example, consider the fitted data shown below:

The weighted-profile R-factor based on the diffraction peaks alone with the background subtracted is 8.1%, but with the background included in the calculation, it drops to 2.5%. Given the peak to background ratio of this data set, the second R-factor is very misleading. If all the points in the profile are included, then an even lower weighted-profile R-factor is obtained, namely 1.8%. This example may seem a little extreme, but it does demonstrate some of the problems in comparing weighted-profile R values: to know how good a fit may be in terms of its R-factor requires a detailed knowledge of the software used for its calculation.
All is not lost, however, if another R-factor, known as the expected R-factor is calculated on the same basis as the weighted-profile one. This second R-factor, which essentially is a measure of data quality, is defined as follows:
| Rexp = | { | ( N - P + C ) | / | Σ i |
wi yi(obs)2 | }1/2 × 100% |
While the weighted-profile R-factor is the most direct measure for monitoring convergence of the refinement, it is useful to know whether inadequate fits are due to poor structural parameters (e.g. a wrong model) or simply poor instrumental parameters. Rietveld conceived of other R-factors that did not involve the peak-shape function, such as R-factors based on the F squared. Probably the most useful of the non-profile R-factors is the so-called intensity R-factor, which is defined as:
| RI = ( | Σ hkl |
| Ihkl (obs) - Ihkl (calc) | / | Σ hkl |
Ihkl (obs) ) × 100% |
The obvious question though is what is I(obs)? Since it is a diffraction profile that is measured, individual integrated peak intensities are not directly observed (even for systems with cubic symmetry). Rietveld devised a method of estimating I(obs) based on the intensity of the profile points. His method is relatively simple: each profile point y(obs) is partitioned in proportion to the calculated components of y(calc) due to each reflection. Thus supposing that two reflections contribute to a calculated profile point with 400 and 600 counts each and the observed profile point is 1100 counts, then the "observed" individual counts to the profile point are 1100×400/(400+600) and 1100×600/(400+600), i.e. 440 and 660 counts, respectively. These individual components to the profile intensity are then summed over the whole range of each peak to give an "observed" peak intensity value. Obviously, the reliability of I(obs) is highly model dependant, but with a reasonable model sensible numbers are usually obtained. For the fit shown above, the intensity R-factor is equal to 5.6%. Note that this R-factor is unweighted, and that it is unaffected by scaling of the observed profile data.
You may wonder what sort of R-factor values are considered to be good, and what are poor or downright bad? There is no definitive answer to this question, except to say that good R-factors from Rietveld programs will, in general, be higher than the equivalent ones from small-molecule crystallography, but much less than those obtained in protein crystallography. To some extent the answer depends on the purpose of the refinement: accurate structural parameters will only be obtained when both the weighted-profile and expected R-factors are low in value; for quantitative analysis (as discussed in later section) low values are not necessarily essential.
Although the R-factors are very useful measures of how a refinement is proceeding, they must never be used as the sole criterion for judging the quality of the profile fit. Neither should they be used for determining whether the refinement process has converged: parameters that lie in a shallow minimum give only small changes in weighted-profile R-factor as they approach the true minimum. It is better to compare the ratio of the shift on every parameter, δp, to its estimated standard deviation, σ. Only when the ratio of these two numbers (δp/σ) is less than a certain value, e.g. 0.1, for every refined parameter can the refinement process be considered as having converged. The next page explains how the estimated standard deviations are calculated.
| © Copyright 1997-2006. Birkbeck College, University of London. | Author(s): Jeremy Karl Cockcroft |