 |
Using Rietica: IV. Backgrounds |
 |
Using Rietica: IV. Backgrounds |
Backgrounds
There are several approaches to the treatment of powder diffraction pattern backgrounds. Historically, and probably the simplest approach, is to treat the background graphically, i.e. to draw in the background as a series of connected points. Rietica permits the use of other methods, e.g. refinable polynomial functions, which you can explore later at your leasure.
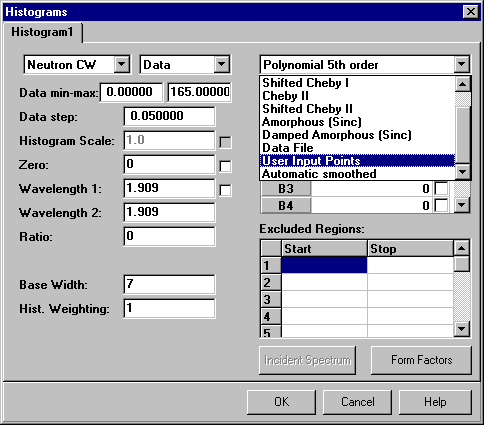
The option Histograms in the pull-down menu Model allows you to setup information regarding the data. Many of the values in the menu below have defaulted according to the preferences set for the instrument type that you setup earlier. The default background option is a 5th order polynomial, but on the pull-down menu shown below you will see the option for User Input Points, which is second from bottom of the list (and sometimes out of sight):
The data range has defaulted to the entire range measurable by the instrument. If we want the program to set the 2q range to the limits of the data as actually measured, then one can simply set the start, end, and step size in 2q all to zero. Note that the GUI interface automatically adds in two background points with zero count at the 2q extremes determined by the data limits (as seen below). These will be deleted later.
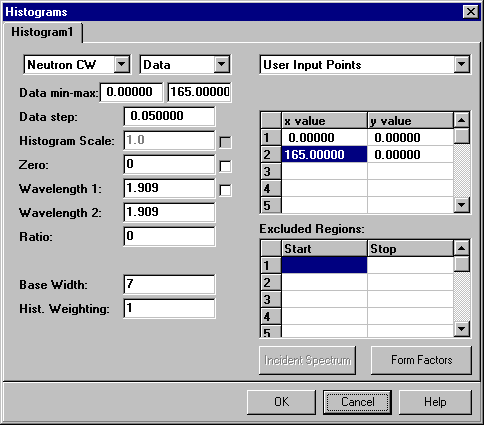
Having set the background type to be points defined by the user, click on OK. The next step is to display the data. Do NOT use the open file option described earlier, which allowed you to simply view the data. Choose the option Refine from the pull-down menu Rietveld on the main task bar of Rietica. The window shown below will then be displayed:

Notice that the options for Dynamic Plotting and Update are enabled. To display the data and current background, click Start and the plot window will appear:
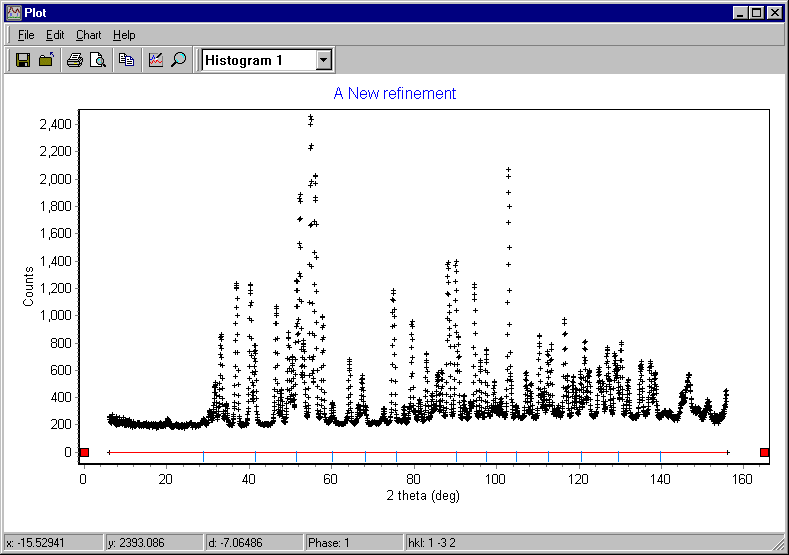
You can now see the two arbitrary background points added in by the GUI shown in red, and these are connected by a red line. Ignore the blue reflection markers at this point: these have been generated using a default cubic unit cell whose parameters you will change later on.
The next step is far from obvious! You can now bring up a background menu up by clicking with the right-hand button of the mouse (while the mouse is kept stationary) as shown next:
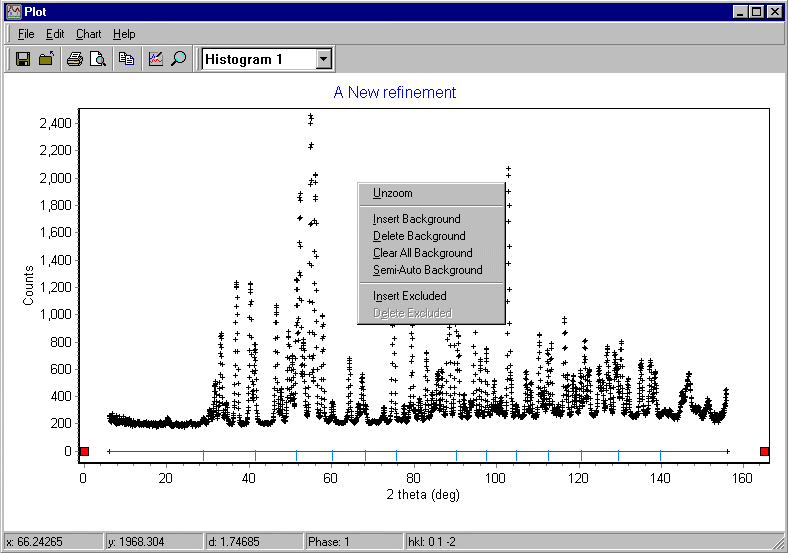
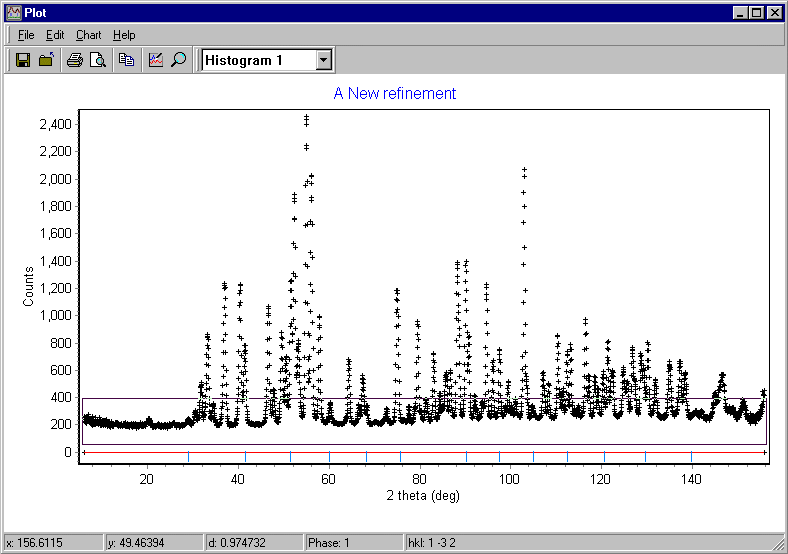
Firstly, choose Clear All Background to remove the two default points. The next step is to expand the plot so that background of the diffraction pattern is approximately in the middle of the plot. This will enable you to draw in background points with reasonable precision: this is necessary given the precision of your computer screen and mouse. You can expand the plot using the mouse by left clicking and then dragging the mouse (while holding the left button is down). A rectangle will appear marking the limits for the new plot as shown below:
Use right-hand mouse button again to bring up background menu and this time use the Insert Background option to add background points as shown below. Rietveld programs always require the background points to be listed from low to high 2q values, so it is good practice to draw them in this way. (Note that the GUI will sort the points, so don't worry if you want to go back and add in a few more.) Clicking with the mouse adds in a background point as shown by the red dots in the screen plot below:
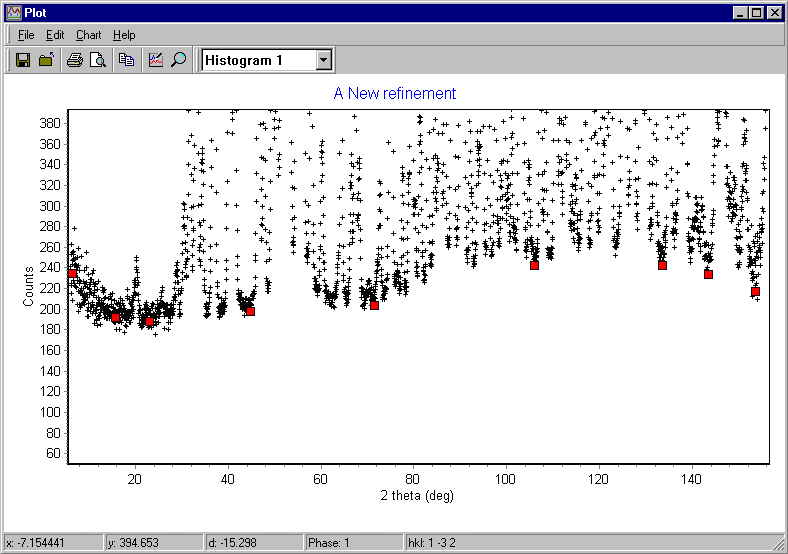
One useful tip here: Do not put to many points in. A common error made by beginners is to use too many background points. You should also remember the mid-point between peaks will not reach background level due to the overlap of the tails of the peaks. Once you have succesfully refined your crystal structure, you can always go back and "refine" by hand your choice of background points.
When you are happy with your choice of points, use the pull-down menu File on the plot with the option Exit to save the background values. You may want to see numerical values for the background points. The simplest solution here is to view the "raw" input crystallographic file using the Information pull-down menu on the main program task bar and choose option View Input, as shown here:
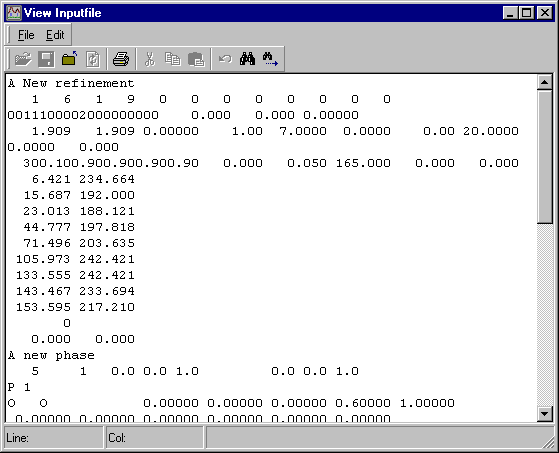
The crystallographic input file for Rietica is a fixed format text file and the background points are stored near the top in two columns. In the above screen plot, the background points are:
   6.421 234.664
  15.687 192.000
  23.013 188.121
  44.777 197.818
  71.496 203.635
 105.973 242.421
 133.555 242.421
 143.467 233.694
 153.595 217.210
with the list ending with a zero. (The numbers are far too precise, but never mind.)
|
© Copyright 2001-2006.
Birkbeck College, University of London.
|
Author(s):
Jeremy Karl Cockcroft Lachlan M.D. Cranswick |