 |
Fourier Maps |
 |
Fourier Maps |
Fourier Maps
The usual equation for the calculated structure factor is in terms of a model based on point scatterers whose x,y,z position is smeared out by thermal motion, i.e.
| Fhkl = | Σ n |
bn Nn exp { 2πi (hxn + kyn + lzn) } exp { - Bn sin2θ / λ2 } |
where F is a vector with both amplitude F and phase φ. Theoretically, the structure factor is the Fourier transform of the scattering density, ρ(x,y,z), (i.e. electron density for X-ray scattering and nuclear density for neutron scattering) taken over the whole unit cell, i.e.
| Fhkl = | c ∫ 0 |
b ∫ 0 |
a ∫ 0 |
ρ(x,y,z) exp { 2πi (hx + ky + lz) } dx dy dz |
Crystallographers use atomic coordinates and thermal displacement parameters as a convenient approximation (i.e. model) of the scattering density ρ(x,y,z). Suppose that we have F and want ρ(x,y,z): we can then use the reverse Fourier transform to obtain ρ. This time the integral can be replaced by a summation over all reflections as indicated below:
| ρ(x,y,z) = | Σ hkl |
Fhkl exp { −2πi (hx + ky + lz) } / V |
In theory, the above summation is over all possible hkl values from -∞ to +∞. In practice, however, the summation is always finite, because only a finite number of reflection intensities is available for the calculation. There is in every case an upper limit on this number, owing to the general requirement that sinθ <1, which implies a maximium possible value for sinθ / λ. Although the summation contains imaginary terms in i, these all cancel out if the summation is performed correctly: afterall, the scattering density is a real quantity.
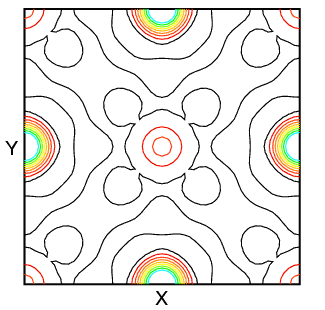
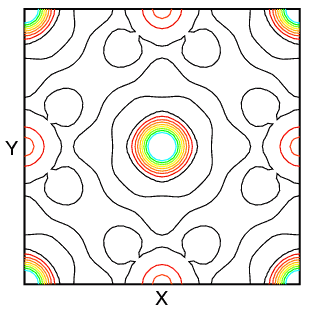
You may wonder about this use of the Fourier transform in crystallography. The scattering density ρ(x,y,z) is usually calculated as a regular grid in x, y, and z. It may then be displayed as either a 2- or 3-dimensional Fourier map. Two-dimensional maps are typically drawn with contours (and sometimes colour) to indicate different density levels, while three-dimensional maps employ a chicken-wire style mesh representing a single level. (The latter works very well in protein crystallography, where 99% of the atoms (excluding H) scatter near identically.) Some typical 2-dimensional maps of the planes z = 0 and z = 0.5 in sodium iodide calculated using X-ray structure factors are shown below:
 |
 |
 |
| z = 0 | NaI Structure | z = 0.5 |
|---|
The zero level density contour is shown in black, while the colours red through to blue-green indicate increasing levels of electron density. In the structure, the sodium cations are at 0,0,0; 1/2,1/2,0; etc. and the iodide anions are at 1/2,0,0; 0,1/2,0; etc. The difference in the scattering density between iodide anion and sodium cation is very marked.
The structure factor itself is a quantity with both magnitude F that is measured and a phase φ that is not, i.e.
So in order to calculate the scattering density function (and "see" the atoms), we need to know the phase φ of each reflection hkl. Here we have the so-called phase problem in crystallography. Given this difficulty, how can the transform for the scattering density be exploited?
A Rietveld refinement of an initial structure with, say, missing atoms will give a poor fit between observed and calculated profiles. During the fit procedure, the Rietveld program calculates F(calc) and φ(calc) for each reflection (though not for symmetry-equivalent ones). In addition the program extracts I(obs) for use in calculating the intensity R-factor. From I(obs) it is a simple step to obtain "F(obs)". This observed value is very model dependent, so care must be taken with the interpretation of any parameters derived from it. Given the three quantities F(calc), F(obs), and φ(calc), we can now calculate three types of Fourier map, which are referred to as calculated, observed, and difference maps.
The map of sodium iodide shown above is an example of a calculate Fourier map since it is based purely on calculated F and φ values. It is not a very useful map, although it can be used to check that the Fourier program is working correctly. Probably the most useful is the difference map since this can be used to locate missing atoms in a crystal structure. One of the best examples of the use of this technique in powder diffraction is in the location of guest molecules in framework structures such as zeolites, a method first pioneered in powder diffraction by Fitch et al. when working at the ILL, Grenoble. The method is simple in concept, but much harder in practice, often due to the poor software interface between Rietveld and Fourier-map programs.
In a difference Fourier map, the calculated structure factors are subtracted from the observed ones as shown in the equation below:
| ρ(x,y,z) = | Σ hkl |
{ Fhkl(obs) - Fhkl(calc) } exp { −2πi (hx + ky + lz) } / V |
The resulting scattering density ρ(x,y,z) will correspond to atoms missing in the calculated model structure. Consider the problem of locating benzene in sodium-exchanged zeolite Y. In this study, the calculated structure factors were based on the bare framework structure and sodium cations, while the observed structure factors were based on the diffraction data of the benzene containing zeolite. So by subtraction, it should be possible to find the location of the benzene molecules in this zeolite. This sounds easy until you remember that we can't measure F(obs)!
The solution is simple: for the strong reflections the phases of F(obs) and F(calc) will be similar when the model structure is close to reality, while for weak reflections they may be quite different. But since weak reflections make only a small contribution towards the calculated scattering density, then their incorrect phasing is of little importance anyway. So in a difference Fourier map, φ(obs) is set equal to φ(calc). In order to demonstrate the use of the above equation, the original data on benzene in zeolite Y will be used. Zeolite Y is cubic with space group Fd-3m. The formula of zeolite Y exchanged with sodium cations used in the original experiment was Na0.29Si0.71Al0.29O2.
With the atoms Na/Si/Al/O atoms in their correct positions, a weighted-profile Rfactor of 45% is readily obtained based on these atoms only. The most revealing difference Fourier maps turned out to be those whose planes were perpendicular to the threefold axis of the cube as shown below, where the X and Y directions refer to [1-10] and [01-1], respectively.
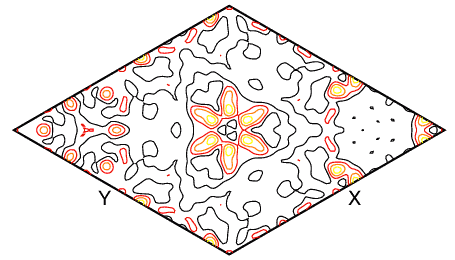
The benzene molecule is clearly visible at the centre of the map. In fact there are two crystallographically-distinct benzene molecules in this structure, and the second molecule may be found by a similar method. Note that the map contains many other spurious peaks, many of which correspond to the atomic positions of framework atoms. This is common in Fourier maps, especially from powder diffraction data, owing to the approximations made in obtaining both F(obs) and φ(obs).
The above map was calculated using data measured out to 156° 2θ at 1.909 Å. If a Fourier map is calculated using data to 60° 2θ, then the low-resolution map shown below is obtained.

The location of the benzene molecule in this map is not so obvious (unless you happen to know its location already). This Fourier map demonstrates nicely the importance of high-resolution data, i.e. data measured to high sinθ / λ, for the determination of precise atomic positions.
To complete the story, Rietveld refinement of the two structure with the two different benzene molecules produces the fit shown below, with a weighted-profile R-factor of about 13.3%, expected 6.5%, using isotropic temperature factors for the atoms.

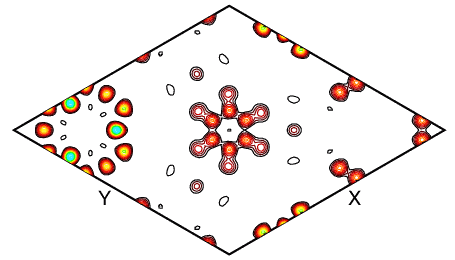
So what does an observed Fourier map look like? When a good fit to the data is obtained, then the observed and calculated Fourier maps should look very similar. The atoms in the final observed Fourier map should be more distinct that in the difference maps made to find the missing atoms. This is demonstrated in the observed Fourier map below, where the individual C and D atoms of the benzene are clearly seen, together with some of the framework atoms that almost lie in the same plane.
The refinement of the structure of benzene absorbed in zeolite Y was made easier by the fact that some of the symmetry of the benzene molecule matched that of the zeolite framework. As a result, each C6 ring in the benzene molecule can be generated from a single crystallographic C atom. This is an example of a rare crystallographic constraint. In practice, restraints would often be required to fix the molecular geometry. These form the subject of the next few pages.
| © Copyright 1997-2006. Birkbeck College, University of London. | Author(s): Jeremy Karl Cockcroft |