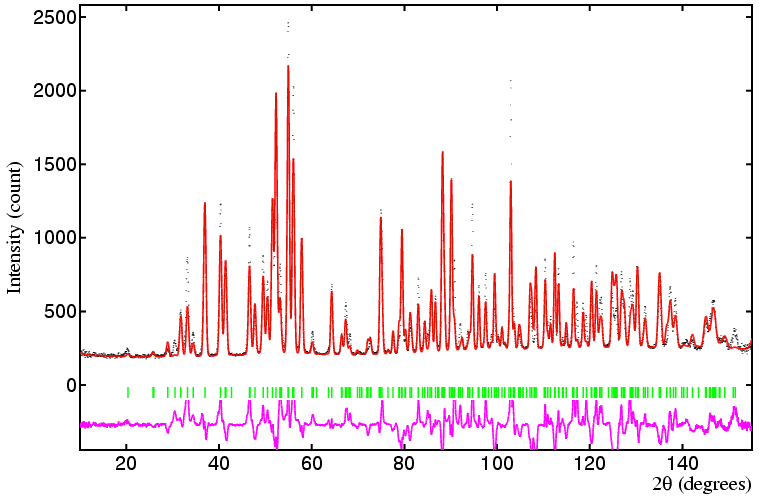

Observed, calculated, and difference profiles after refinement of the scale factor, unit-cell parameters, 2θ zero error, and atomic coordinates of Pb, O(1), O(2), and O(3). The deviations shown in the difference profile are still too large to be of much use at this stage of the refinement process
| © Copyright 1997-2006. Birkbeck College, University of London. | Author(s): Jeremy Karl Cockcroft |