 |
Sources of Peak Broadening |
 |
Sources of Peak Broadening |
Sources of Peak Broadening
We address the question of what causes peak broadening, resulting in the peak shapes we have just discussed. If we had a perfect sample and a perfect diffractometer the diffraction peaks would be extremely sharp (peak widths as narrow as seconds of arc). In practice such perfection is not realised and typically good powder diffraction patterns display peaks with widths that are measured in hundredths of degrees. This broadening arises from two sources:
(a) Instrumental Contributions
(b) Sample Contributions
Before we discuss these contributions in more detail it is necessary to first familiarise ourselves with the idea of convolution as it applies to this situation. We have here two effects: broadening from an imperfect diffractometer ("instrument") and broadening from an imperfect sample. These effects are inter-dependent in the sense that any imperfection in one (e.g. just one imperfect powder crystallite) will in turn be subject, statistically, to all the imperfections of the other (the instrument), and then the same applies to the next crystallite and so on. So to determine the final result we have to sum every combination of the imperfections of one factor acting upon all the imperfections of the other factor. This type of situation is known mathematically as a convolution and is expressed by an equation that might look like:
| I(2θ) = |
-∞ ∫ +∞ |
Iinstrument (ψ) Isample (2θ - ψ) dψ |
where ψ plays the part of a dummy variable covering the full range of possibilities. However the important point of all of this seemingly "side issue" is to realise that the effects of convolution are not always intuitively obvious. Some functions convolute in a simple way: For example two Gaussian functions convoluted with each other produce another Gaussian function in which the final width follows a simple square law:
Gaussian:
whereas two Lorentzians convoluted would yield a width equal to just the sum:
Lorentzian:
Other functions may convolute in more complex fashion to the point that the final function is unrecognisable from the original two functions. De-convolution (the reverse procedure in which one recreates one of the original two functions from the convoluted result and a knowledge of the other original function) is equally non-obvious and in some cases is impossible. The take home lesson from all of this is that determining, say Bsample, from the measured broadening, Btotal, is not necessarily simple. However there are many research situations where a highly rigorous and accurate value is not required and an approximate value would suffice. In some situations it may, for example, be acceptable to assume either the Gaussian or Lorentzian cases given above.
Returning then to the two sources of broadening:
A. The Instrumental Contribution.
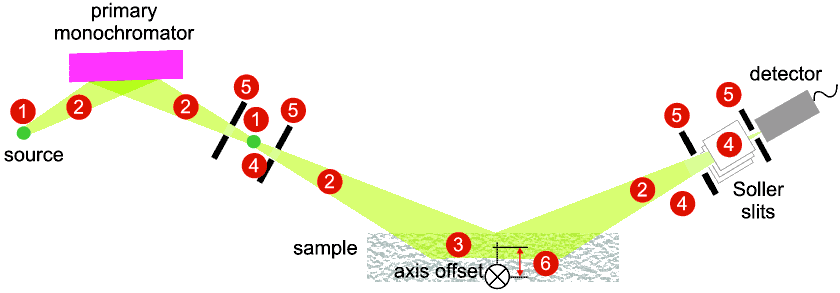
This arises from factors such as the following:
These effects are illustrated symbolically below:

The usual way to measure the Instrumental broadening contribution of a diffractometer is to use a near-perfect sample whose broadening contribution is negligible in comparison. Suitable materials for this purpose include LaB6, BaF2 and KCl.
B. The Sample Contribution.
This arises from factors (T.Ungar in "Industrial Applications of X-ray Diffraction" eds: Chung & Smith, Marcel Dekker, New York, @2000, page 847) such as:
More rigorous methods are mentioned later. The usefulness of Bsample is discussed next.
|
© Copyright 1997-2006.
Birkbeck College, University of London.
|
Author(s):
Paul Barnes Simon Jacques Martin Vickers |