 |
Comparison of Laboratory and
Energy-Dispersive Diffraction Data |
 |
Comparison of Laboratory and
Energy-Dispersive Diffraction Data |
Comparison of Laboratory and Energy-Dispersive Diffraction Data
A direct comparison of angle- and energy-dispersive diffraction data is not
straightforward because the experimental conditions and objectives are
usually quite different in the two cases.
Data from both types of experiment may be plotted as a function of 1/d
(as shown below),
but care should be taken in making comparisons by this method. In particular,
the ability to resolve peaks depends on the choice of wavelength in the
angle-dispersive case and on the choice of detector angle for the
energy-dispersive case. One solution is to compare data sets in which the
data have been collected over a near identical range of d spacings.
Thus an energy-dispersive instrument with the detector set to, say, 6°
and a maximum detector energy of, say, 150 keV, will measure
d spacings down to 0.790 Å: this is equivalent to
measuring with an angle-dispersive diffractometer to an angle of 160°
using
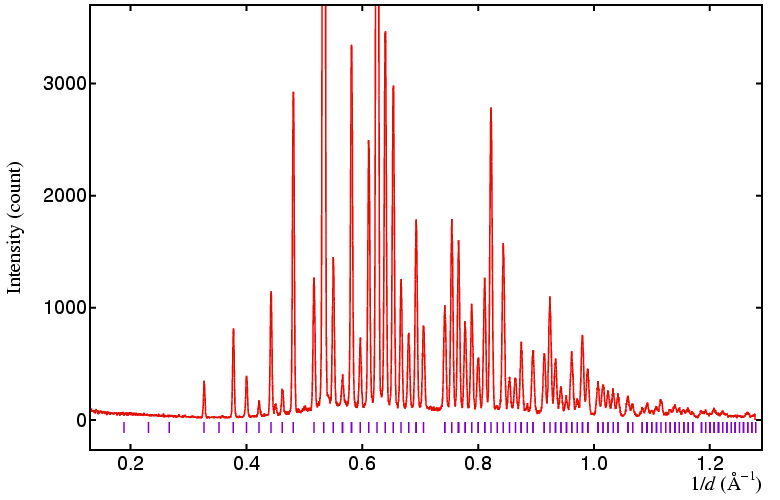
The first data set shown below is of the standard yttria sample measured by energy-dispersive diffraction with the detector at 6° (as shown earlier), but with the data plotted in 1/d. You will notice that the intensity of the peaks is strongly influenced by the wavelength spectrum of the incident white X-ray beam and by absorption effects; the intensity of the peaks with large d spacings is near zero due to the fact that they were measured with relatively low-energy X-rays that have been absorbed by the sample, while the intensity of the peaks with small d spacings is reduced by the fact that the flux of incident X-rays is much reduced for the highest energies measured by the detector.


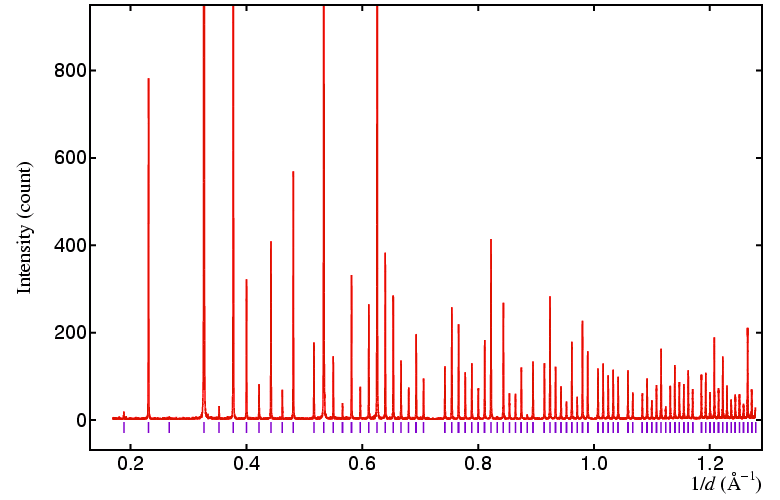
For comparison, a laboratory data set on the same sample is shown directly
above collected with Cu Kα1 radiation
(
| © Copyright 1997-2006. Birkbeck College, University of London. | Author(s): Jeremy Karl Cockcroft |