 |
Energy-Dispersive Detector Angle |
 |
Energy-Dispersive Detector Angle |
Energy-Dispersive Detector Angle
Choice of Detector Angle
The ability to resolve peaks in an energy-dispersive diffraction (EDD) experiment depends heavily on the choice of detector angle. As the detector angle is decreased, so the range of d spacings measured by the detector is also decreased, i.e. fewer reflections are measured. Thus decreasing the detector angle in an EDD experiment is equivalent to increasing the wavelength in an angle-dispersive experiment in respect of covering an equivalent d-spacing range.
The following data sets were collected on a standard yttria sample on beamline ID09 at the ESRF, Grenoble, using a 50 by 50 micron incident beam and 20 by 20 micron detector collimation at the following detector angles: 6°, 4°, 3°, and 2.5°, respectively. The equivalent angle-dispersive wavelengths given in the figure captions below refer to the wavelength required to obtain an equivalent d-spacing range.
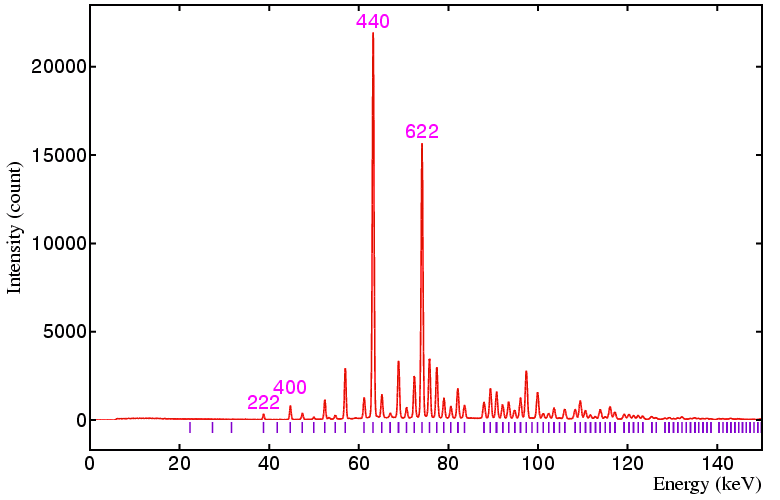
Figure 2. Detector at 4°, minimum d is 1.184 Å,
angle-dispersive wavelength equivalent is 2.33 Å.
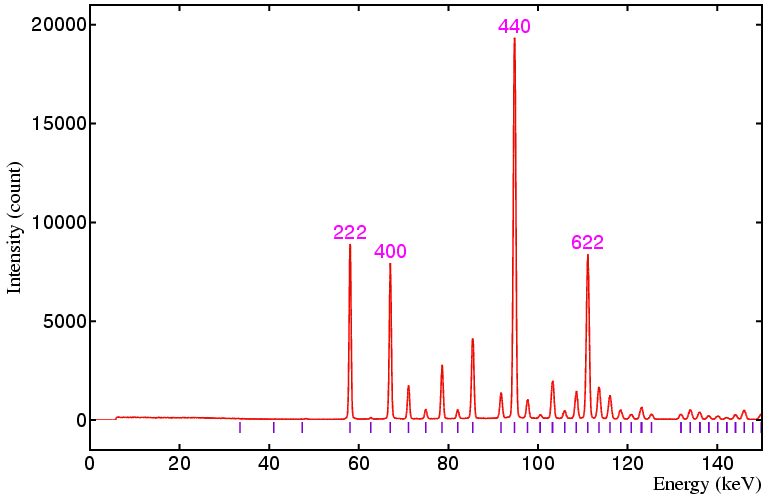
Figure 3. Detector at 3°, minimum d is 1.579 Å,
angle-dispersive wavelength equivalent is 3.11 Å.
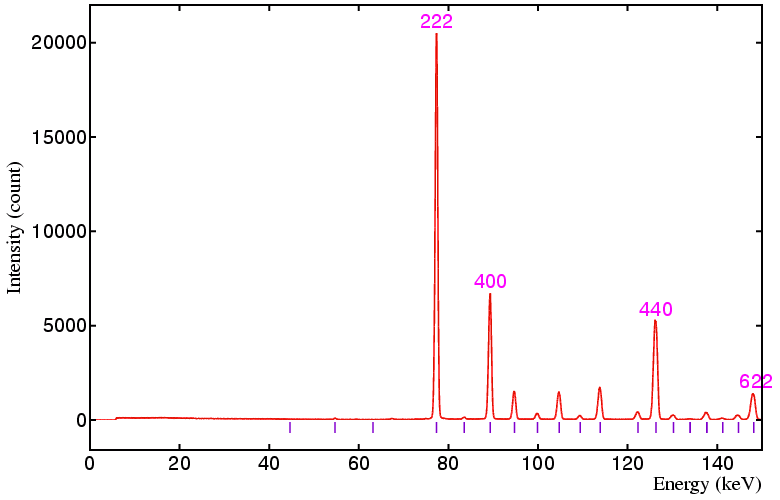
Figure 4. Detector at 2.5°, minimum d is 1.895 Å,
angle-dispersive wavelength equivalent is 3.73 Å.
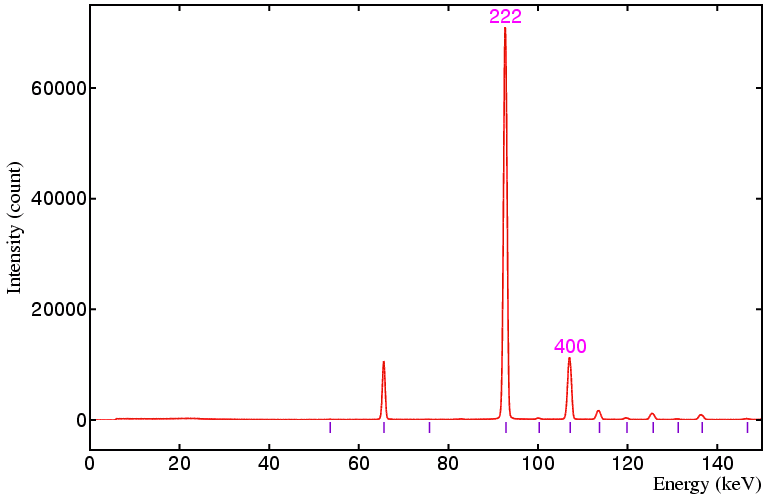
In the above figures you should notice that the width of the peaks (in keV) increases as the detector angle is decreased from 6° down to 2.5°. However, the expansion of the 1/d spacing scale with decreasing detector angle more than compensates for the increased peak width: thus peaks with similar d spacings will be easier to resolve at smaller detector angles, assuming of course that they can be observed within the energy range of the detector.
As well as choosing a detector angle that provides an appropriate range of d spacing values, it may be necessary to adjust the angle so as to avoid interference from fluorescence lines induced in the sample itself. Normally this is not a problem for samples containing only elements with low to medium atomic number (e.g. C, O, Al, Si, Fe, Y, and Ag), but fluorescence lines from heavy elements (e.g. W, Pt, and Pb) may interfere or partially overlap with diffraction peaks from the sample. Since the fluorescence lines are independent of detector angle (in marked contrast to the diffraction peaks), a small change in the detector angle can be made so that such interference is avoided.
Detector Angle Calibration
As well as calibrating the detector channels for energy, it is also
a requisite of any EDD experiment to calibrate the effective scattering
angle of the detector. This is readily done using a standard sample: for
example, the yttria
It is good practice to use many peaks from the data set and to employ a least-squares fitting procedure if a very accurate value for 2θ is required.
| © Copyright 1997-2006. Birkbeck College, University of London. | Author(s): Jeremy Karl Cockcroft |