 |
Generation of X-rays |
 |
Generation of X-rays |
Generation of X-rays
Laboratory X-ray sources can be classified into two types: sealed-tube and rotating anode. Both may be used to generate monochromatic X-ray radiation and they basically differ only in the intensity of the radiation produced.
White Radiation
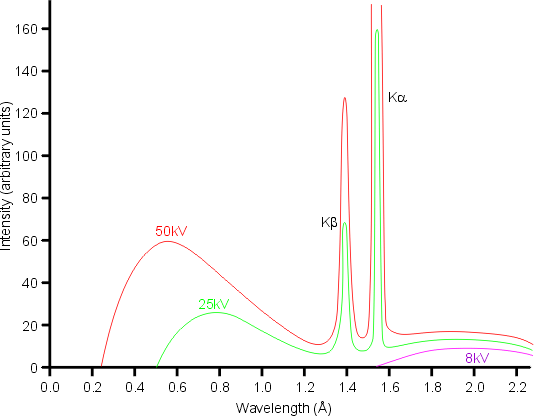
X-rays are generated when matter is irradiated by a beam of high-energy charged particles such as electrons. In the laboratory, a filament is heated to produce electrons which are then accelerated in vacuum by a high electric field in the range 20-60 kV towards a metal target, which being positive is called the anode. The corresponding electric current is in the range 5-100 mA. The process is extremely inefficient with 99% of the energy of the beam being dissipated as heat in the target. A typical X-ray spectrum from a copper target is shown below:

The loss of energy of the electrons by collision with the atoms usually takes place via multiple events. The result is the production of a continuous spectrum of X-rays known as white radiation. The maximum energy lost, E(max), determines the shortest wavelength, λ(min), that can be obtained according to the equation
The total intensity, I(w) of the white radiation is approximately proportional to the filament current, i, the atomic number of the anode target, Z, and the square of the accelerating voltage, V.
Characteristic Radiation
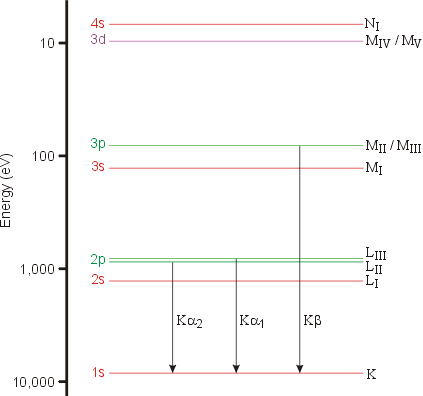
When the energy of the accelerated electrons is higher than a certain threshold value (which depends on the metal anode), a second type of spectrum is obtained superimposed on top of the white radiation. It is called the characteristic radiation and is composed of discrete peaks. The energy (and wavelength) of the peaks depends solely on the metal used for the target and is due to the ejection of an electron from one of the inner electron shells of the metal atom. This results in an electron from a higher atomic level dropping to the vacant level with the emission of an X-ray photon characterised by the difference in energy between the two levels. The diagram below show the electronic energy levels for a copper atom:

The characteristic lines in this type of spectrum are called K, L, M,... and they correspond to transitions to orbitals with principal quantum numbers 1, 2, 3,... When the two orbitals involved in the transition are adjacent (e.g. 2 → 1), the line is called α. When the two orbitals are separated by another shell (e.g. 3 → 1), the line is called β. Since the transition for β is bigger than for α, i.e. ΔEβ > ΔEα, then λβ < λα. This is demonstrated by the values of the Kα and Kα wavelengths in the table below for two common anode materials:
| Anode | Kα | Kβ |
|---|---|---|
| Cu | 1.54184 Å | 1.39222 Å |
| Mo | 0.71073 Å | 0.63229 Å |
In the copper X-ray spectrum, only 2 characteristic lines are seen at low-energy resolution and a bar (-) is often used above the α to indicate that it is a weighted mean value. (This effect is difficult to achieve in the HTML language and so the bar has been omitted.) However, at higher resolution the Kα1 line is readily seen to be a doublet, which is labelled as Kα1 and Kα2 where ΔEα1 > ΔEα2. The splitting of the 2p orbitals in copper, i.e. the splitting of the energy levels LII and LIII, is very small (0.020 keV) and so the two wavelengths Kα1 (= 1.54056 Å) and Kα2 (= 1.54439 Å) are very similar.
You may wonder why so few transitions are shown in the figure: the allowed transitions are determined by a set of selection rules that state that an outer s or d electron cannot fill the hole left by the ejected 1s electron, but that p electrons can.
Spectral Line Shape
The above picture is actually a simplified version of reality since a high-resolution analysis of the spectral lines of, say, Cu Kα shows that both the α1 and α2 peaks are distinctly asymmetric. An explanation of the origin of this asymmetry is important in understanding the so-called fundamental parameter approach to the profile fitting of powder diffraction data peaks.
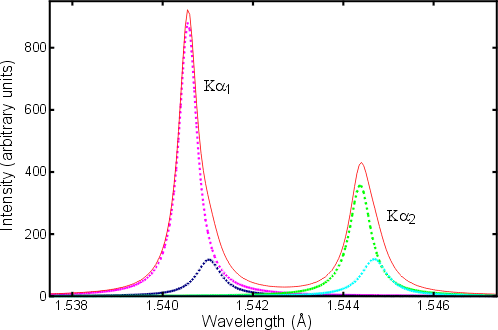
The de-excitation process in which an outer 2p electron fills the inner 1s electron shell is fast (≈ 10-12 s), but not fast enough to stop double ionization events. In particular, the ejection of the initial 1s electron can be followed by the loss of one of the 2s or 2p electrons from the energy levels LI, LII, or LIII. The effect of the increased ionization on the atom is to change slightly the energy gap between the K and L levels resulting in slightly different wavelengths for the emitted X-ray photon. The resulting peak asymmetry in the spectral distribution of the Kα lines of copper is shown in red in the diagram below:

The dotted coloured lines represent individual spectral contributions to the total (taken from the article by H. Berger in X-ray Spectrometry, 1986, 15, 241-243).
Spectral Intensity
In the above figure, it is readily seen that the intensity of the Kα1 peak is almost exactly double the intensity of the Kα2 peak. You might ask how this compares to the Kβ radiation or even the white radiation. The intensity of a K line is given approximately by the formula
What about the intensity of the Kβ radiation? Again considering a copper anode, the intensity of the Kα lines is approximately 5 times that of Kβ. Hence, all instrumental setups are optimized around the Kα radiation, and preferably around Kα1 when high resolution monochromators are used as part of the X-ray optics.
| © Copyright 1997-2006. Birkbeck College, University of London. | Author(s): Jeremy Karl Cockcroft |