 |
A Geometrical Representation |
 |
A Geometrical Representation |
A Geometrical Representation
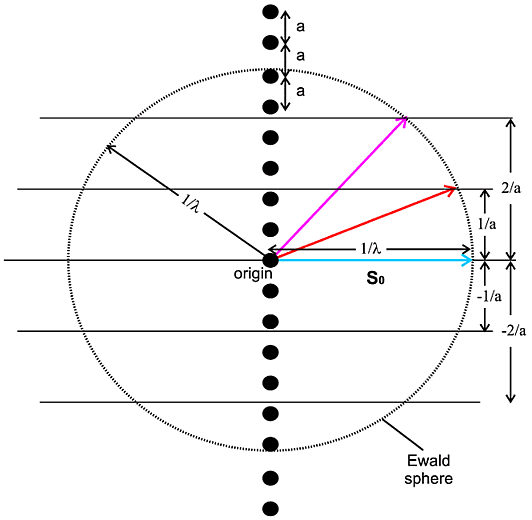
It turns out that the previous case, scattering by a one-dimensional chain, can be visualised by means of a geometrical figure known as the Ewald sphere (or sphere of reflection) plus the reciprocal lattice. As this idea crops up so often in crystallography texts, it is worth explaining briefly at this point. We saw in the previous figures that as the number of atom/molecule repeats (N) increases we get peaks of intensity, which are known as diffraction peaks. It is relatively easy to show that these peaks occur when a relationship between the chain (embodied by the repeat separation a) and the angle of scattering (embodied by S) is satisfied. This relationship is usually expressed in vector form and known as a von Laue condition, after von Laue who won the Nobel prize for his fundamental experiments on diffraction in 1912:
| a.S | ||
| or in non-vector form: | ||
|
|

In this diagram the vector shown in cyan of length
1/λ represents the incident X-ray beam so. A circle is
then drawn, of radius 1/λ, which represents all the potential scattering
beams, of which two cases are illustrated. This circle is known as the Ewald
sphere. Next a line (really a horizontal plane emerging from your screen) is
drawn distant 1/a from the centre of the sphere. Where this plane
intersects the sphere, the condition in the above equations is satisfied for
h = 1 and diffraction can occur. Therefore diffraction will
occur in the direction indicated by the vector shown in
red. Similarly another plane can be drawn distant
2/a from the sphere centre and, for where this intersects the sphere,
diffraction can again occur in the direction indicated by the vector shown in
magenta, now with h = 2 (see above
equations). Other cases can be drawn (e.g. h = -1, -2) though,
as drawn in this particular case, the higher integer cases (3, 4 etc.) will
occur outside the Ewald sphere and therefore not have an associated diffraction
event. So we see that by drawing
i. a sphere of radius 1/λ to represent the incident and
potential diffracted X-rays,
ii. a set of parallel planes 1/a apart to represent the
repeated atoms/molecules a apart,
we predict when diffraction can occur. The former is known as the Ewald sphere
and the latter is known as the reciprocal lattice (for this particular case).
It is a construction often used and referred to in crystallography. Note that
this construction tells you when diffraction will occur but does not tell you
how intense the diffraction will be - you need to know what the repeating
atom/molecule is to gauge that. One final point for this case is that this
construction is really a 3D construction (3 dimensional; see below) of which
the above diagram is a 2D-projection.

|
© Copyright 1997-2006.
Birkbeck College, University of London.
|
Author(s):
Paul Barnes Simon Jacques Martin Vickers |