 |
Search-Match |
 |
Search-Match |
Search-Match
There is no point in creating a database without a method for searching it. The concept of "Search-Match" is as old as the ICDD database itself since the most common use of the database is for qualitative PXRD analysis.
Printed Search Manuals
Hanawalt created a search-match index based on the 3 most intense peaks for each phase in the database (as given on the cards), which is known as the Hanawalt Index. The reason for this choice is that the most intense peaks from each phase are the easiest peaks to identify in a mixture of diffracting phases. The index for a particular compounds was sorted into d-spacing ranges (e.g. 3.74 to 3.60 Å) based on the most intense ("strongest") peak and then within a range, the index was sorted by the d-spacing value for the second strongest peak. The logic behind this is that increases the speed of manual searches using printed tables. The 45 ranges for the first peak were chosen to given an approximately equal number of entries for each 2θ range for ease of manual searching (not needed for computer searching) as shown below:
| dmax | dmin | dmax | dmin | dmax | dmin | dmax | dmin | dmax | dmin | ||||
|---|---|---|---|---|---|---|---|---|---|---|---|---|---|
| ∞ | 10.00 | 3.89 | 3.75 | 3.04 | 3.00 | 2.50 | 2.44 | 1.77 | 1.68 | ||||
| 9.99 | 8.00 | 3.74 | 3.60 | 2.99 | 2.95 | 2.43 | 2.37 | 1.67 | 1.58 | ||||
| 7.99 | 7.00 | 3.59 | 3.50 | 2.94 | 2.90 | 2.36 | 2.30 | 1.57 | 1.48 | ||||
| 6.99 | 6.00 | 3.49 | 3.40 | 2.89 | 2.85 | 2.29 | 2.23 | 1.47 | 1.38 | ||||
| 5.99 | 5.50 | 3.39 | 3.32 | 2.84 | 2.80 | 2.22 | 2.16 | 1.37 | 1.00 | ||||
| 5.49 | 5.00 | 3.31 | 3.25 | 2.79 | 2.75 | 2.15 | 2.09 | ||||||
| 4.99 | 4.60 | 3.24 | 3.20 | 2.74 | 2.70 | 2.08 | 2.02 | ||||||
| 4.59 | 4.30 | 3.19 | 3.15 | 2.69 | 2.65 | 2.01 | 1.94 | ||||||
| 4.29 | 4.10 | 3.14 | 3.10 | 2.64 | 2.58 | 1.93 | 1.86 | ||||||
| 4.09 | 3.90 | 3.09 | 3.05 | 2.57 | 2.51 | 1.85 | 1.78 | ||||||
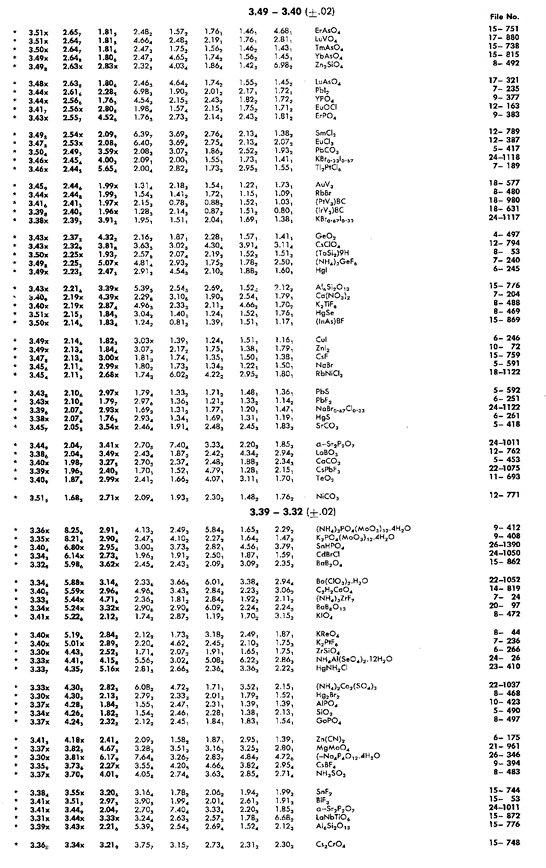
Two typical pages showing a section of the table from a search manual that formed part of the 1976 teaching edition of the database (i.e. a small subset of it at that time) is shown below:
 |
 |
with an expanded section shown below for clarity. Further information on the information shown is available by clicking on the image.
Note that the search table lists d-spacing values for 4th-8th strongest peaks in addition to the three of the Hanawalt Index. The purpose of this was to save time by avoiding false matches and needless reference to the main database.
Since in a mixture of phases, the intensity of the peaks may not be in the same order as for a pure single phase material where I1 > I2 > I3 due to random peak overlap and experimental errors on the intensities, and so the order will be less obvious if I1 ≈ I2 or I2 ≈ I3. In particular, depending on how some samples are prepared for PXRD measurements, preferred orientation may be present, i.e. the crystallites may not be randomly aligned. The latter is strongly dependant on the measurement geometry used: flat-plate Bragg-Brentano, focussing Debye-Scherrer with a capillary, or thin-foil transmission methods may cause some samples to exhibit preferred orientation. (The presence of preferred orientation is easily checked by making measurements with the different geometries mentioned.) For these reasons, additional entry rules in the search manual were created:
The original function of the ICDD database was to identify minerals for use in the mining industries and so it was not aimed at synthetic chemists or pharmaceutical chemists. The first teaching edition of the search manual from 1976 had 48 pages for inorganic/minerals and less than 2 pages for organics! Manual searches are easier if one limits the search to a particular area of science. Consequently, separate search manuals have been created for inorganic and for organic/organometallic compounds, a concept similar to that of the single-crystal structural databases where there is a clear separation between the ICSD (Inorganic Crystal Structure Database, Karlsruhe) and the CSD (Cambridge Structural Database at CCDC, UK). In addition, sub-indices have been created for specialist use: e.g. metals and alloys, forensics, ceramics, cements, pharmaceuticals, etc. In addition, there are alphabetical indexes based on mineral or common name, and chemical formula.
The search manuals are still published in paper form (but on very thin paper!) as seen in the picture below:

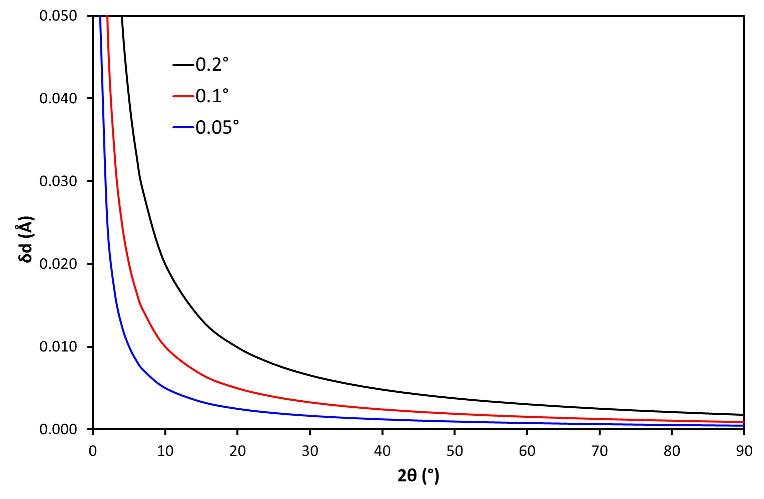
Before attempting a search match using manually, it is important to have an appreciation of the error limits on the d-spacing values measured in an experiment. In many angle-dispersive PXRD experiments, the error in determining a 2θ value is approximately constant, though it will increase as the peak intensities drop at higher angle and as the peaks broaden with increasing angle. The graph below shows the variation in error in d-spacing value as a function of 2θ for three different, but constant, errors in 2θ, namely 0.2°, 0.1°, and 0.05°.

For modern (post 1980s) PXRD diffractometers equipped with a Cu X-ray anode, the error is typically less than half the instrumental peak width, so less than 0.05°, so the error curve shown in blue is the most relevant. Note that for each of the error curves, the precision of the d-spacing values increases dramatically at low scattering angles. In addition, any misalignment of the instrument will be most noticeable at these angles so due care must be taken when comparing these d-spacing values with other measurements.
Given this variation is d-spacing error, it is usually best to compare the results of qualitative analysis with the original data plotted in 2θ space, a trivial exercise with computer-based search match, but less common when qualitative analysis is done manually.
Manual Search-Match Methods
The first step in a manual analysis of the data is to reduce the experimental data to a series of pairs of dn, In values, which are then sorted in order of decreasing In and then normalised to the intensity of the most intense peak. (This type of exercise is readily performed in Excel and formed the basis of the qualitative analysis practical at UCL from 2005-2015.)
The next step is to use then use a search manual and to find the range with d1 in it and then to search column 2 for a match within the expected error limits for the value of d2. This is very quick as column 2 values are in exact decreasing order in the Hanawalt search manual. If no match is found, then one tries looking for a match for d3, d4, d5, etc. in turn. The reason for this process is that initially there is no information as to which peaks belong to which phase.
If a match found is found in column 2, it is important to first check that the value in column 1 matches (as these correspond to a range of values), and then to check if there other matches within the 8 listed values. At this point, the database entry is noted and the entry is looked up in the database to obtain the full PXRD pattern for the material. The full database pattern should be compared to the experimental pattern.
Once a match is found, all the peaks for that material can be eliminated from the list of dn, In values. Care should be taken not to accidentally eliminate peaks that have a chance match in d-spacing value with another phase, so it is very important to check that the intensities match as well as the d-spacing values. Thus if a peak appear strong in the measurement but is listed as relatively weak in the database for that material, then probably there is a coincidental peak match with another phase.
Once the peaks from the identified phase are removed from the list, the process of search-match is repeated until all of the phases are identified or until no further matches can be made (e.g. if the material is novel and not known in the database).
Computerised Search-Match Methods
The actual algorithms used in computerised search-match methods vary from one manufacturer to another, and most will have changed over the years as computing power has dramatically increased over the decades. In addition, commercial secrecy and the competition involved in the sale of X-ray equipment means that it is becoming more difficult to know the precise details of what happens within the X-ray analysis software. In the Department of Chemistry at UCL, students have access to the software package "Eva" for search-match which comes with X-ray equipment sold by Bruker. Other X-ray manufacturers have their own software. More recently, the custodians of the various databases have developed their own software, e.g. the ICDD has the product SIeve™ for search-match use.
The older approach was similar to that employed in a manual Hanawalt-type search described above in the raw diffraction data was reduced to a set of dn, In values which could then be compared to the PDF-2 database. In practice, algorithms subtracted the background from the experimental data so that automatic algorithms for peak searches produce a sensible set of dn, In values. Searches could be based on the whole database, but with the risk of a lot of false positive to check, or on subsets of the database based on a particular sub-file of the database, e.g. only organics. The search can be limited further by using chemical composition knowledge, e.g. insisting the compound contains, say, copper or other elements chosen from the Periodic Table. There is a danger in this approach in that an unexpected substance may not be identified, e.g. when an unexpected chemical reaction occurs in synthetic chemistry.
|
|
|