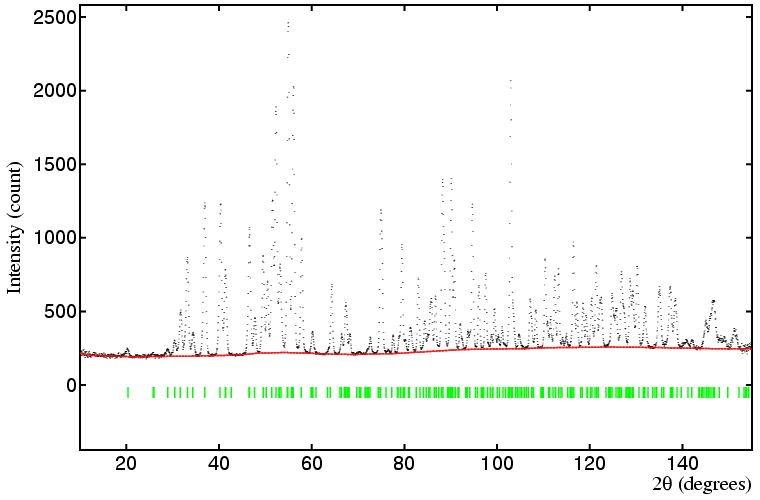

The black dots show the observed diffraction profile; the green vertical tick marks show calculated reflection positions (for a given set of lattice parameters); and the red line shows the calculated profile, which is just the graphically-estimated background function in this instance. A difference plot for observed and calculated profiles (yi(obs)-yi(calc)) is not shown here.
| © Copyright 1997-2006. Birkbeck College, University of London. | Author(s): Jeremy Karl Cockcroft |