 |
A Taster |
 |
A Taster |
A Taster
For once it might be better to start a topic halfway than at the beginning, to give you a taste of why so much effort has been expended over the years on the development of powder diffraction for identification. Much of the material around us is in a form that is relatively convenient for powder diffraction analysis. Identification of such material by powder diffraction rests on two underlying principles: (1) that a powder diffraction pattern is a unique identifier of a given crystalline compound (or phase); (2) that if then we had a database of all known powder diffraction patterns we should be able to use it to check out any "unknown material" against current knowledge. Of course if an "unknown" is a true original, then it cannot exist in the database and the method fails. For this reason, the international organisation, ICDD (International Centre for Diffraction Data), continually strives to update the PDF (powder diffraction file). In many ways the situation resembles that of tracing criminals from their fingerprints, the powder diffraction pattern being analogous to the finger print.
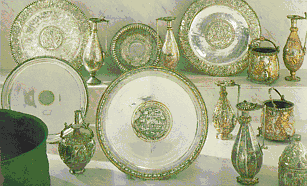
Examples of using powder diffraction as a tool for identification are many and as diverse as geological exploration, chemical engineering trouble shooting, authentication of works of art, criminal investigation and so on. As an introduction we give one recent example of work in which we participated at the request of Dr. Anna Bennett, a Conservation Restorer from Conservation and Technical Services, Birkbeck College (see external links). This concerned an international dispute over the origin of a silver collection known as the Sevso Silver treasure shown below (see external links).

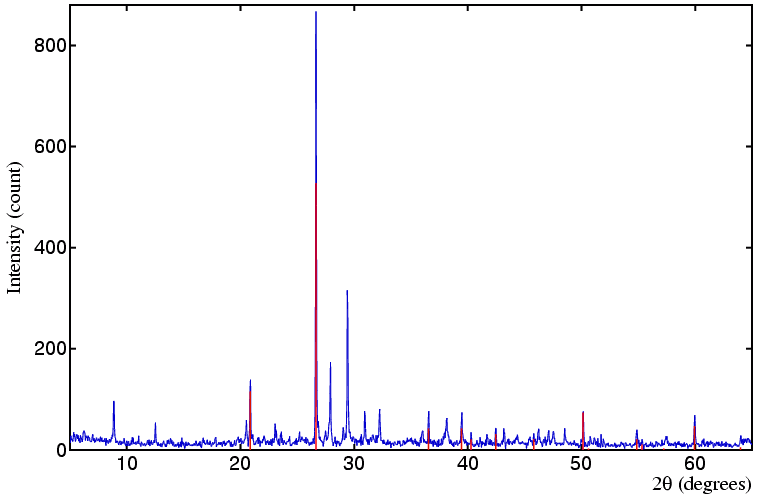
It was the largest ever find of Roman silver and became the subject of much media attention after being put to auction in 1990, three countries claiming to be the rightful owner. In the preliminary stages of the dispute powder diffraction was used to identify the corrosion/adhering material to the silver, so as to make conclusions regarding the type of environment within which the silver had been resting. The samples weighed just a few milligrams each yet the data were of sufficient quality to positively identify 10 phases; in the plot below illustrating this, the continuous blue line represents the sample's powder diffraction pattern and the red sticks indicate the positions of the quartz peaks (the major phase in this sample) as obtained from the ICDD PDF (file number 33-1161).

| Phase | Chemical Formula | PDF File No. |
|---|---|---|
| Calcite | CaCO3 | 5-586 |
| Dolomite | CaMg(CO3)2 | 36-426 |
| Albite | NaAlSi3O8 | 9-466 |
| Sanidine | (Na,K)(Si3Al)O8 | 10-357 |
| Chlorargyrite | AgCl | 31-1238 |
| Monohydrocalcite | CaCO3.H2O | 29-306 |
| Silver Metal | Ag | 4-783 |
| Muscovite | KAl2(Si3Al)O10(OH,F)2 | 6-263 |
| Ferroan Clinochlore | (Mg,Fe)6(Si,Al)4O10(OH)8 | 29-701 |
|
© Copyright 1997-2006.
Birkbeck College, University of London.
|
Author(s):
Paul Barnes Martin Vickers |