 |
Case Study from the Cambridge Structural Database |
 |
Case Study from the Cambridge Structural Database |
Case Study from the Cambridge Structural Database
In this example we search the CDS for structures with the following three restrictions:

Results
The search produces 6 structures that fulfill the requirements of this search.
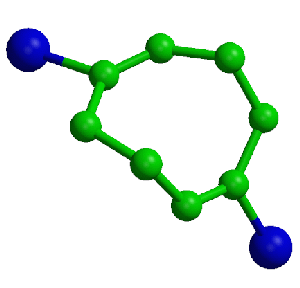
The actual type of information produced for one of these structures is illustrated for C8H10Br2. The red italicised text is for explanation purposes only and is not given in the actual output.
1D Information
TERSOY                                                    Reference Code
1,5-Dibromocyclo-octa-1,5-diene                           Chemical Name
C8 H10 Br2                                                Molecular Formula
A.Davila,M.L.McLaughlin,F.R.Fronczek,S.F.Watkins          Authors
Acta Crystallogr.,Sect.C(Cr.Str.Comm.), 53, 84,1997       Journal Reference
2D Information

3D information
3D Molecular Structure


The data from which the 3D structures are derived may be output as text files
with the following format:
(a)TERSOY  23970221     13  9 20  0  0  4  3 10 10 0 22132100000010000000000097
(b)188917 (c)46858 (d)12
(i)R=0.0380 (j)CIF entry bk1224.
211 0121 0112 0011 0121 0110 6211 6121 6112 0011 6121 6110 6
C  68H  23BR121
(k)BR1 66801  48532  73984  C1     58660  24130  74170 C2   50860  18670  62730
C3     43440   -170  59990  C4     62750  14480  88000 H1   49800  28900  55100
H2     39800  -5000  50700  H3     45800 -19100  65000 H4   65200  32100  93100
H5     67900   1700  90800  (l)C4A 37250  14480  62000 C1A  41340  24130  75830
BR1A   33199  48532  76016  C2A    49140  18670  87270 C3A  56560   -170  90010
H2A    60200  -5000  99300  H3A    54200 -19100  85000 H1A  50200  28900  94900
H4A    34800  32100  56900  H5A    32100   1700  59200
2 3 4 7 2 3 0 4 5 5 4111212 515151411111415
where (referring to the red letters in the above table):
Geometric parameters from the above coordinates can be derived, such as, bond
lengths and bond angles, and are output in the following format:
TERSOY   geometric data.
 Bond lengths
  Br1   C1    1.928   C1    C2    1.314   C1    C4    1.500   C2    C3    1.504
  C2    H1    0.991   C3    H2    0.965   C3    H3    1.022   C3    C4A   1.508
  C4    H4    0.975   C4    H5    1.002   C4    C3A   1.508   C4A   C1A   1.500
  C4A   H4A   0.975   C4A   H5A   1.002   C1A   Br1A  1.928   C1A   C2A   1.314
  C2A   H1A   0.991   C2A   C3A   1.504   C3A   H2A   0.965   C3A   H3A   1.022
 Bond angles
  Br1   C1    C2    117.3   Br1   C1    C4    110.9   C2    C1    C4    131.8
  C1    C2    C3    128.3   C1    C2    H1    114.3   C3    C2    H1    117.4
  C2    C3    H2    106.3   C2    C3    H3    112.2   C2    C3    C4A   113.7
  H2    C3    H3    105.9   H2    C3    C4A   106.1   H3    C3    C4A   111.9
  C1    C4    H4    102.8   C1    C4    H5    106.5   C1    C4    C3A   116.6
  H4    C4    H5    108.0   H4    C4    C3A   111.7   H5    C4    C3A   110.6
  C3    C4A   C1A   116.6   C3    C4A   H4A   111.7   C3    C4A   H5A   110.6
  C1A   C4A   H4A   102.8   C1A   C4A   H5A   106.5   H4A   C4A   H5A   108.0
  C4A   C1A   Br1A  110.9   C4A   C1A   C2A   131.8   Br1A  C1A   C2A   117.3
  C1A   C2A   H1A   114.3   C1A   C2A   C3A   128.3   H1A   C2A   C3A   117.4
  C4    C3A   H2A   106.1   C4    C3A   H3A   111.9   C4    C3A   C2A   113.7
  H2A   C3A   H3A   105.9   H2A   C3A   C2A   106.3   H3A   C3A   C2A   112.2
Statistical Analysis
Below is an example of the type of simple statistical analysis that is
possible using the CDS.
The analysis is of the C-Br bond lengths in the 6 structures containing the
fragment we discussed above.

Nfrag  Refcode    CBR1    CBR2    CBR
    1  AERTHNa    1.918   1.889   1.904
    2  AERTHNa    1.838   1.904   1.871
    3  ARPLYS     1.894   1.879   1.886
    4  EXBSUN     1.910   1.911   1.911
    5  GAJVOCb    1.846   1.848   1.847
    6  GAJVOCb    1.895   1.848   1.871
    7  JAWVOS     1.903   1.903   1.903
    8  TERSOY     1.928   1.928   1.928
      Nent  6
            Nobs             8         8         8
            Mean         1.891     1.889     1.890
            SDSample     0.033     0.029     0.026
            SDMean       0.012     0.010     0.009
            Minimum      1.838     1.848     1.847
            Maximum      1.928     1.928     1.928
aThere are 2 entries for AERTHN as there are 2 crystallographically
different fragments in the same molecule.
Histogram for parameter CBR1

(Bond length range)   (Number of bonds in range)
  1.835 TO  1.840     1 *
  1.840 TO  1.845     0
  1.845 TO  1.850     1 *
  1.850 TO  1.855     0
  1.855 TO  1.860     0
  1.860 TO  1.865     0
  1.865 TO  1.870     0
  1.870 TO  1.875     0
  1.875 TO  1.880     0
  1.880 TO  1.885     0
  1.885 TO  1.890     0
  1.890 TO  1.895     2 **
  1.895 TO  1.900     0
  1.900 TO  1.905     1 *
  1.905 TO  1.910     1 *
  1.910 TO  1.915     0
  1.915 TO  1.920     1 *
  1.920 TO  1.925     0
  1.925 TO  1.930     1 *

Histogram for parameter CBR2

  1.846 TO  1.850     2 **
  1.850 TO  1.854     0
  1.854 TO  1.858     0
  1.858 TO  1.862     0
  1.862 TO  1.866     0
  1.866 TO  1.870     0
  1.870 TO  1.874     0
  1.874 TO  1.878     0
  1.878 TO  1.882     1 *
  1.882 TO  1.886     0
  1.886 TO  1.890     1 *
  1.890 TO  1.894     0
  1.894 TO  1.898     0
  1.898 TO  1.902     0
  1.902 TO  1.906     2 **
  1.906 TO  1.910     0
  1.910 TO  1.914     1 *
  1.914 TO  1.918     0
  1.918 TO  1.922     0
  1.922 TO  1.926     0
  1.926 TO  1.930     1 *

Histogram for parameter CBR

  1.846 TO  1.850     1 *
  1.850 TO  1.854     0
  1.854 TO  1.858     0
  1.858 TO  1.862     0
  1.862 TO  1.866     0
  1.866 TO  1.870     0
  1.870 TO  1.874     2 **
  1.874 TO  1.878     0
  1.878 TO  1.882     0
  1.882 TO  1.886     0
  1.886 TO  1.890     1 *
  1.890 TO  1.894     0
  1.894 TO  1.898     0
  1.898 TO  1.902     0
  1.902 TO  1.906     2 **
  1.906 TO  1.910     0
  1.910 TO  1.914     1 *
  1.914 TO  1.918     0
  1.918 TO  1.922     0
  1.922 TO  1.926     0
  1.926 TO  1.930     1 *
| © Copyright 1997-2006. Birkbeck College, University of London. | Author(s): Martin Attfield |