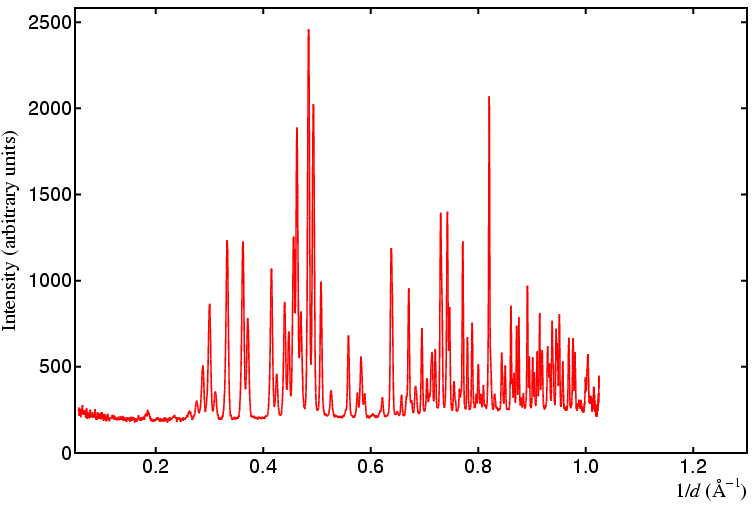
The two data sets may be compared directly by plotting in 1/d or d space. Angle-dispersive and energy-dispersive data are usually plotted as a function of 1/d for comparative purposes, but as will be shown later, neutron diffraction data from a pulsed source is usually plotted as a function of d. There are several caveats when converting angle-disperive data to a 1/d scale: it is important to know the wavelength and any angle aberations (e.g. 2θ zero error) precisely; otherwise additional errors can be introduced into the data when converting 2θ values to 1/d (or d) values.
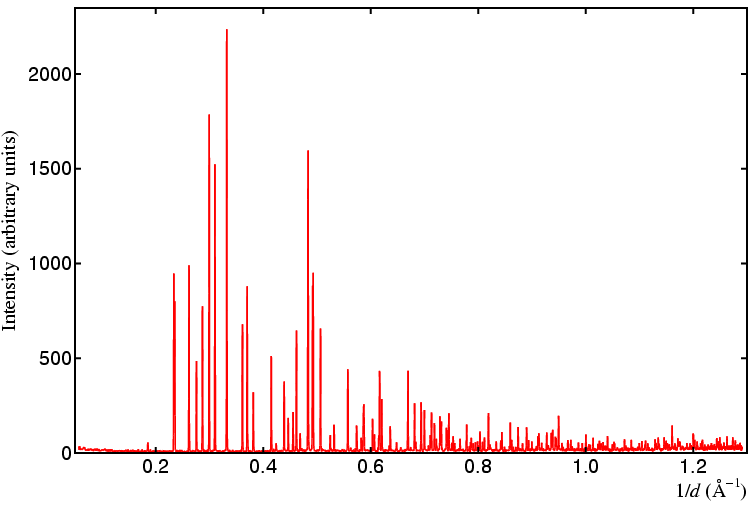
The first data set below shows the laboratory X-ray data set:
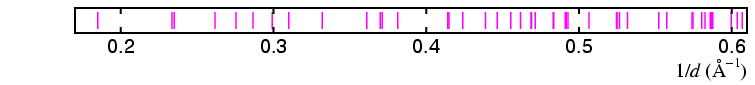
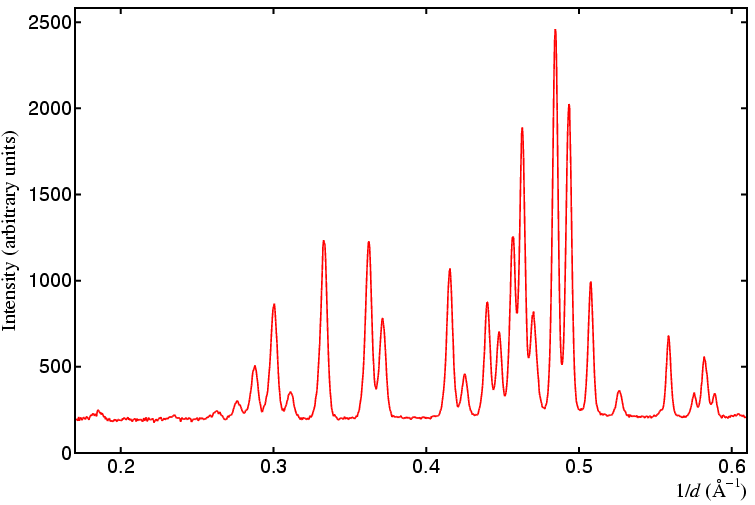
The figures below show the same data (X-ray followed by neutron), but now plotted over a smaller range of 1/d so that individual peaks can be seen more clearly. The calculated positions of the peaks is shown in the narrow figure with the magenta vertical tick marks.

| © Copyright 1997-2006. Birkbeck College, University of London. | Author(s): Jeremy Karl Cockcroft |