 |
Basic Concepts |
 |
Basic Concepts |
Basic Concepts
Crystalline materials may be characterized in terms of a 3-dimensional motif known as the unit cell which has a particular shape (determined by the crystal system) and size and by the atomic (or ionic) contents of that unit cell. Such materials in polycrystalline form can be thought of as having a "unique" structure that can diffract X-rays to give a "unique" powder X-ray diffraction pattern analogous to that of a fingerprint. This concept is not without its caveats. Many inorganic materials comprising simple spherical ions (e.g. metal cations, and anions such as halide or oxide) often exhibit isomorphous, high symmetry structures. If the cations (and anions) in two such structures are of a similar size and scattering power to each other (e.g. Eu2O3 and Gd2O3), then the powder patterns may appear not so unique on a cursory inspection.
A second caveat concerns framework structures such as zeolites, MOFs (metal-organic framework structures), and organic channel solvates. The crystal structures of such framework materials may exhibit unit cells of similar size but with variable or different contents potentially leading to similar PXRD patterns, which again may appear not so unique on a cursory inspection.
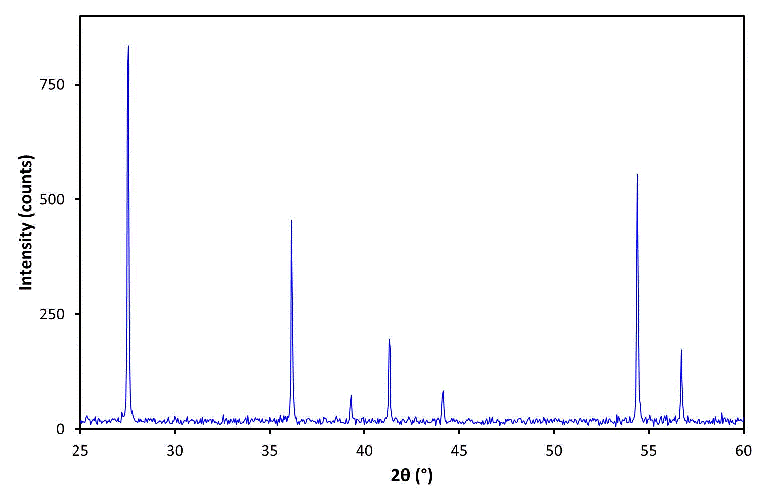
The figure below shows (in blue) an experimental powder X-ray diffraction (PXRD) pattern of one of the polymorphs of titanium oxide:

The POSITION (i.e. 2θ value) of the peaks in a PXRD pattern are determined by the unit cell vectors a, b, and c of the diffracting polycrystalline material. The 2θ values are a function of the wavelength λ used for the measurement and the d-spacings as given by the Bragg equation λ = 2d sinθ; and the d-spacing values are a function of the unit cell parameters and the reflection indices hkl. It is important to realize that the unique quantity is the d-spacing values of a material and not the 2θ values since the latter are wavelength dependant.
The INTENSITY of the peaks in a PXRD pattern are determined by the contents of the unit cell (i.e. the atom types together with their mean position and vibration) and by various other factors such as instrument geometry and, potentially, the method of sample measurement.
Ideally, if two people measure a PXRD pattern of the same substance in different laboratories under the same experimental conditions, then similar PXRD patterns should be obtained. However, in practice there are several variables to consider:
Comparison of the PXRD pattern of an unknown substance against the PXRD patterns of known pure single-phase materials permits the identification of crystalline components in an unknown substance containing a mixture of crystalline solids. It is important to get an excellent match to both d-spacing and relative intensity values, within the error limits of both types of data. Hence the need for a reliable database of PXRD information on known substances (see next page).
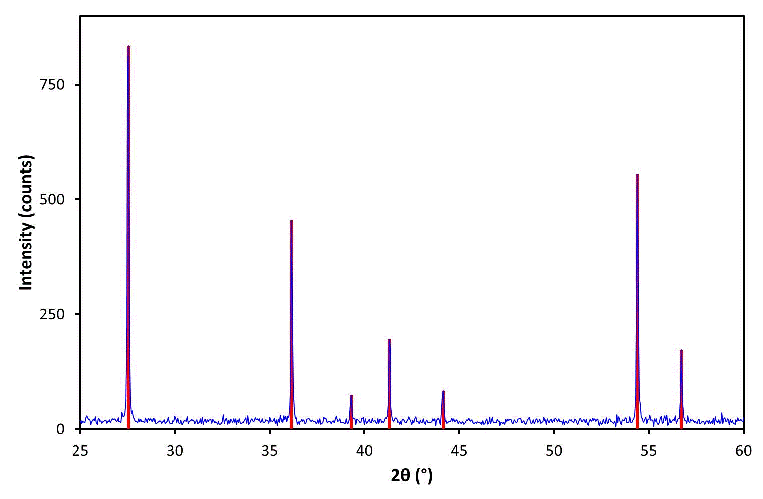
A digital PXRD pattern typically consists of many data points, e.g. a measurement over the 2θ range 0-100° in steps of 0.05° generates 2000 data points. It is often useful to reduce a PXRD pattern to a minimum information content for qualitative analysis, particularly historically, in order to improve the speed of data analysis. A PXRD pattern can be reduced to a list of peak positions (2θ values) and relative peak intensities. The former are converted into d-spacing values so as to remove the wavelength dependency of the measurement. For speed, peak intensity was often equated to peak height, which is a reasonable assumption for peaks of similar widths, in order to avoid peak fitting. To remove count-time dependency, intensity data can be normalised to that of the most intense peak, usually quoted in percentage terms as 100. The reduced data can be shown as a series of "sticks", as represented by the vertical lines (in red) superimposed on the figure below:

The stick diagram shown above could be represented in tabular form as per the table below (where the corresponding hkl values have been included for the indexed pattern). In essence, 700 data points have been reduced to a table of 7 rows and 3 columns: d, I / I1, and hkl.
| 2θ (°) | d (Å) | I (counts) | I / I1 (%) | h k l |
| 27.55 | 3.235 | 834 | 100 | 1 1 0 |
| 36.15 | 2.483 | 455 | 55 | 1 0 1 |
| 39.30 | 2.291 | 74 | 9 | 2 0 0 |
| 41.30 | 2.184 | 196 | 24 | 1 1 1 |
| 44.15 | 2.050 | 83 | 10 | 2 1 0 |
| 54.40 | 1.685 | 555 | 67 | 2 1 1 |
| 56.70 | 1.622 | 173 | 21 | 2 2 0 |
Such tables form the data of various databases used for qualitative analysis by PXRD. Information similar to that shown above forms part of the PDF2 entry for the rutile polymorph of titanium dioxide in the ICDD database, entry 21-1276 (00-021-1276).
|
|
|