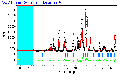
The refinement package selected for the project was LHPM Rietica - downloaded from the CCP14 mirror site. Rietica is a Windows 95/98 based refinement package. At the time of this project, the Version was 1.71. The following two data files were downloaded.
LHPM format: a modified form of ILL data format
Data file
A (2q range is 8° to 62.475° with step
0.025°) (or as Zip file)
Data file
B (2q range 8° to 142.975° with step 0.025°)
(or as Zip
file)
Using the orthorhombic room-temperature structure of lead sulphate as a starting model, the 5K structure was refined using the limited range of data provided in Data File A.
In my early exploration of the Rietica program and by studying its Model/Phases menu, I believed that only standard space-group settings could be entered into the program. At room temperature, the crystal structure of lead sulphate has space-group symmetry Pbnm and thus my original intention was to convert the cell parameters (a,b,c) and the atom co-ordinates (x,y,z) into the standard setting, Pnma. This was carried as follows.
Standard setting, Pnma - 'n' glide plane parallel to x, mirror plane parallel to y and 'a' glide plane parallel to z.
Non-standard setting, Pbnm - 'b' glide plane parallel to x, 'n' glide plane parallel to y and mirror plane parallel to z.
Thus, in order to convert to the standard setting, the old x co-ordinates become the new z co-ordinates, the old y co-ordinates become the new x co-ordinates and the old z co-ordinates become the new y co-ordinates. Similarly, the old a,b,c lattice parameters become c,a,b respectively.
Thus, the lattice parameter values and the atom co-ordinates for the Pnma PbSO4 are as follows.
Cell parameters : a = 8.46618 Å, b = 5.38904 Å, c = 6.94802 Å
Atom co-ordinates :
| Atom | x | y | z | N |
|---|---|---|---|---|
| Pb | 0.1879 | 1/4 | 0.1671 | 4 |
| S | 0.4358 | 3/4 | 0.1848 | 4 |
| O(1) | 0.5907 | 3/4 | 0.0958 | 4 |
| O(2) | 0.3068 | 3/4 | 0.0429 | 4 |
| O(3) | 0.4192 | 0.9727 | 0.4192 | 8 |
These standard co-ordinates are shown here to demonstrate what I would have done if Rietica couldn't take a non-standard space-group. However, with further understanding of Rietica came the realization that non-standard space group settings could be entered - provided the individual letters of the space-group are separated by a space (not obvious by reading the help files). Thus, I used Pbnm as the setting and the cell parameters and atom co-ordinates as shown in orthorhombic room-temperature structure
Refinement Strategy - space group Pbnm, Data File A
A Rietica Input file was created from the above data. During practice use of Rietica using the 300K data an input file was developed. I was able to produce a 300K refinement with final cell parameter values and atom co-ordinates very close to the data provided. I used isotropic temp. factors only. [The course notes explain that atomic thermal vibrations become isotropic as temperature is lowered]. I used my 300K input file as the basis for the initial 5K input file. The initial values for the refinement are shown in the Model/ General,Phases, Histogram and Sample menus.
My refinement strategy was to firstly get the main features of the calculated pattern reasonably correct i.e. background, scale, 2q zero error and peak shape parameters. I then moved on to refine the cell parameters followed by the co-ordinates of atoms on general xyz positions (most degrees of freedom), strong scatters (e.g.Pb) then weak scatters (e.g. S, O). Lastly the isotropic and anisotropic temperature factors were refined. I tried to increase the number of refined parameters gradually, since early trials showed that refinement instability generally occured when I tried to refine too many parameters.
I started with a manually defined background 'User Input Points' since in my early attempts at refinement, the Shifted Cheby II polynomial background did not produce a good fit. I excluded the region 5.7° to 16.7° since it contained no reflections. During refinement, I monitored 3 parameters via the refinement menu, namely, the profile factor, Rp, the weighted profile factor, Rwp and the CHI-squared value c2.
The refinement order taken and my reasons were as follows. Once parameters had been refined they were checked as 'refine' through the subsequent steps. In brackets at the end of each step are the Rp,Rwp and c2 values that were obtained.
Step 1: Background (User Input Points). Establish baseline for calculated reflections (43,54,362).
Step 2: Phase Scale. Get a good start for intensity of reflections (43,52,343).
Step 3: 2q zero error. Improve the positions of the calculated reflections (15,21,53).
At this point I expanded portions of the pattern to examine peak widths, an example is shown here. The peaks were not a good match to the data so I continued as follows.
Step 4: Peak Width W (a simple width) - I wanted to take things steadily (11.6,15.7,30.6).
Step 5: U V GAM0 GAM1 Released the other peak width parameters and also the two main peak shape parameters (11.0,14.6,26.2).
Step 6: Released cell parameters a,b,c - beginning to look at structure (a significant change) (5.7,7.1,6.3).
Step 7: Changed to Shifted Cheby II background - refined first two parameters only (5.4,6.7,5.6).
Step 8: Refined remaining 4 Cheby II parameters (4.8,6.1,4.6).
Step 9: Refined O3 (x,y,z) - general position in orthorhombic space group (4.7,6.0,4.5).
Step 10: Refined Pb (x and y values only) - the z value is fixed at z=1/4 (4.6,5.9,4.3).
Step 11: Refined S (light scatterer), O1 and O2 (x and y values only for all three) - the z values are fixed at z=3/4 (4.4,5.6,4.0).
Step 12: Isotropic temperature factors, Biso for all atoms.(3.9,5.1,3.3).
The refinement of the isotropic displacement parameters (Biso) was stopped after ten cycles. Longer refinements gave some negative values, particularly for Pb(1). This problem suggests an inherent problem with the temperature factors. Since the refinement was on a limited data range and the wrong space group, I did not refine the anisotropic displacement parameters.
Results - space group Pbnm, Data File A
The final contents of Model/Phases, Histogram and Sample menus can be seen by clicking on the links. In addition, the final Rietica Refinement window can be seen by clicking here.
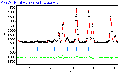
The crystallographic data, instrumental parameters and refinement parameter values can be viewed in the tables.
Comments - space group Pbnm, Data File A
An Rwp of 5.2% and a Rexp= 2.8% indicates an imprecise match of the refined model with the measured diffraction pattern. In addition, the isotropic displacement parameters for all the atoms had large standard deviations with the result that they are only reported to one decimal place. Thus, there is a problem with the anisotropic displacement parameters when Pbnm is used as the space group.
The distances between the lead and oxygen atoms were obtained by clicking on Information/View dist-angles in Rietica. Although lead is not directly bonded to the oxygen atoms, measurements of lead-oxygen distances provided several values from which to calculate an average. A section of the Rietica output file produced is shown here. In order to see whether the calculated distances were reasonable, the Inorganic Structural database was accessed. The Query Request form is shown here. By entering Pb, S and O as the element names a 'distances' table was displayed, as shown here
It can be seen that the lead-oxygen distances determined by Rietica are similar to the expected lead-oxygen distances held for PbSO4 in the ICSD. The average distance between lead and oxygen atoms is approx. 2.7 angstroms. This provides some confidence that the refinement of this limited data-set was reasonably good - at least as far as Pb-O distances are concerned!
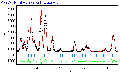
A close study of the final refinement pattern of Data File A suggests that there are problems with the model fit. The widths and shapes of some of the peaks appear to be incorrect for the calculated reflections that are presented. Click on the icons below to again show expanded regions of the pattern - in these images some of the peaks have been labelled and comments made.
There appears to be missing reflections even though a good model fit had been obtained. As the rest of this project report goes on to show, these observed anomalies are due to an incorrect space group being assigned to the model structure.